Daily Charts - Oh Canada & The Rate Cut Dilemma
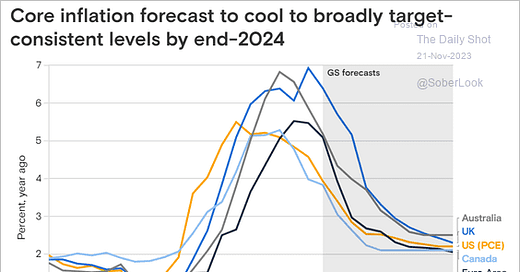
Important chart. Goldman is most bullish out of the Wall Street institutions. Problem is, the bull case is still going to cause problems for over levered balance sheets. Goldman sees inflation settling below 3% but they expect Central Bank Policy Rates in Canada and the US to settle around 3.5% through 2026. There will be balance sheets and business models that don’t survive without zero interest rate policy. What are the implications for Canadian housing? They also see the US cutting last.
Australian consumers are getting hit hardest by rising rates due to the structure of their mortgage market. Australian households having to allocate twice as much income as Americans to service household debt. Canadians aren’t far behind but I’d guess extending amortization periods have spared some Canadians.
Australian, Canadian and South Korean households are some of the most indebted relative to GDP. Note the divergence between Canada and the US after the GFC in 2008.
Good news for Canadian inflation in October. CPI fell from 3.8% in September to 3.1% in October, inline with expectations. Inflation continues to track in the right direction.
So when do Canadian get cuts? It will be tough for the BoC to cut without an imminent move by the US or else the CAD will suffer. Rate cuts are also going to set off the Canadian housing market again, a situation the BoC would like to avoid. Things need to get worse before they can start even thinking about, thinking about cutting. This scares me a bit.
The MoM fall in inflation was driven entirely by energy, the remaining categories were a wash.
3 month food price inflation is starting to normalize to more palatable levels.
Shelter is the one thing pushing Canadian inflation higher. 3 month rent inflation is annualizing at a double digit pace. This seems like more of a supply demand issue created by the Feds, rather than anything to do with monetary policy. I also imagine this data is fairly lagged.
In a historical context, it seems problematic. Highest levels in 40 years. The cherry on top is new construction has slowed due to elevated rates. Comments from National Bank:
Recall that Canada's record housing supply imbalance, caused by an unprecedented increase in the working-age population (874,000 people over the past twelve months), means that there is currently only one housing start for every 4.2 people entering the working-age population, a 5 standard deviation from the historical ratio of 1 housing unit started for every 1.8 people. Under these circumstances, people have no choice but to bid up the price of a dwindling inventory of rental units.
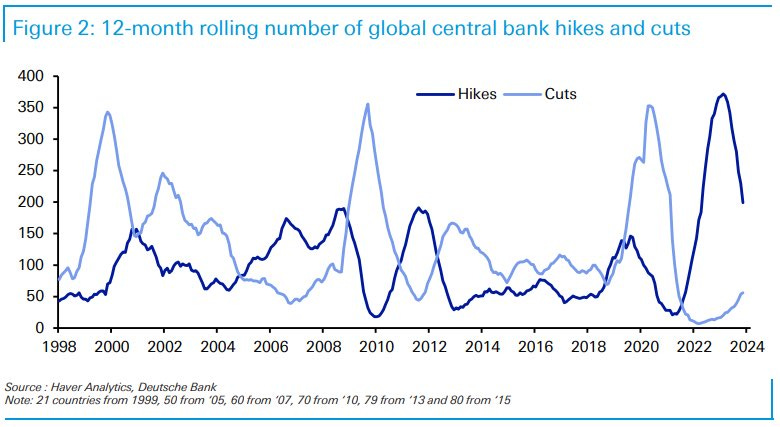
For the first time since January 2021 more Central Banks are cutting than hiking.
Another way to look at the changing trends.
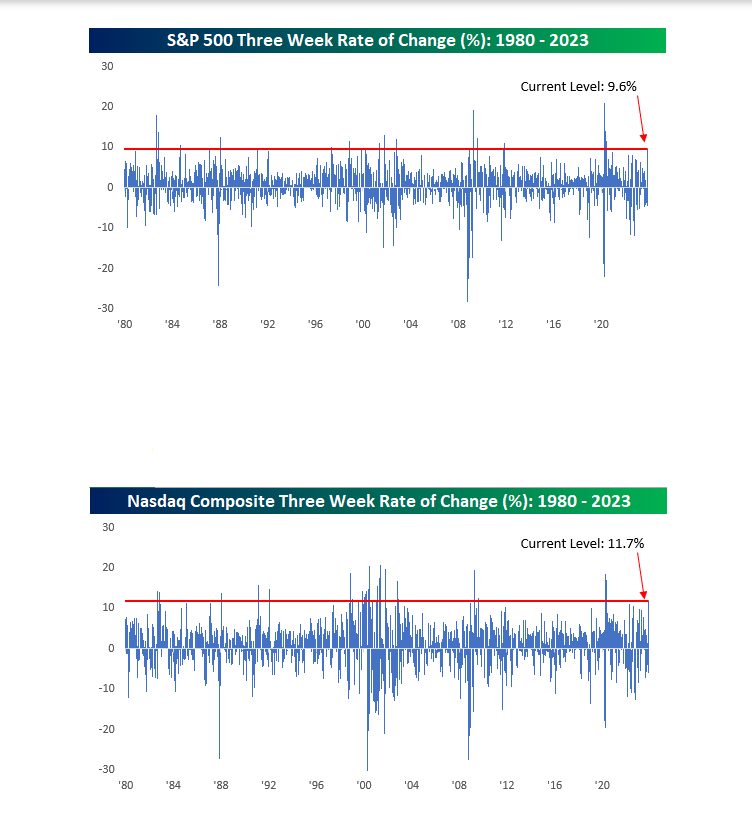
Markets are celebrating the easing of financial conditions. The three-week rallies in the S&P 500 and the Nasdaq are the largest since the first half of 2020 and 2008 before then.
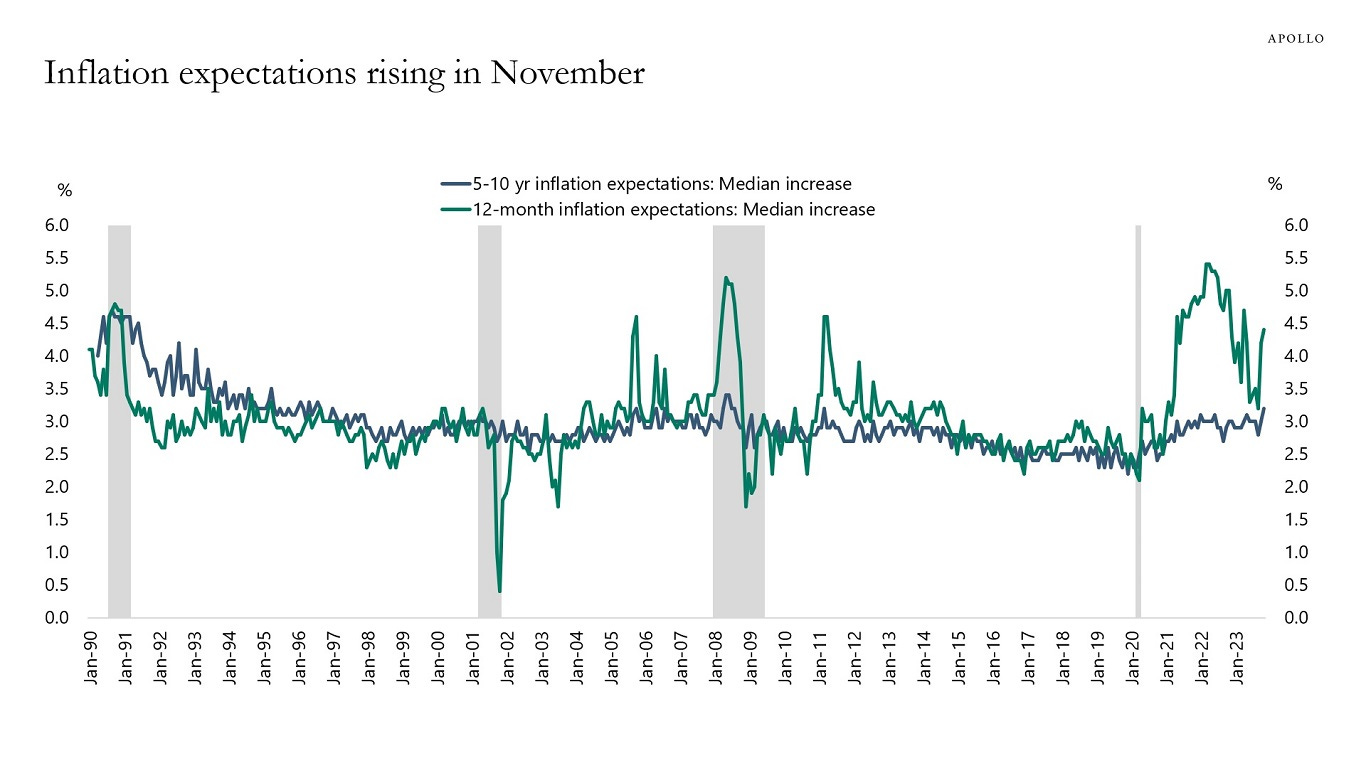
The market rally and subsequent easing of financial conditions led to an increase in expectations, leaving us back to square one, pointing to rates being higher for longer.
From 1981-2019 Canada had:
The fastest growing GDP in the G7
The 2nd slowest-growing GDP per capita (ahead of only Italy)
The 2nd slowest-growing GDP per working-age adult (ahead of only Italy)
Canada is now left with some demographic advantages but we will have to figure out how to transform that into productive growth.


