Daily Charts - Currencies and Canadian Households
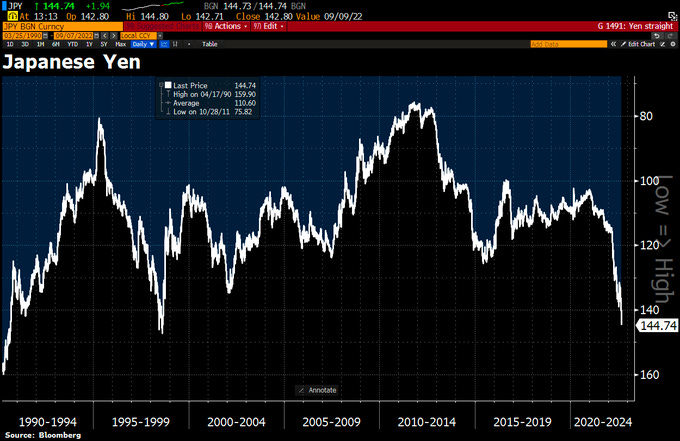
Divergent central bank policy is causing pain for certain developed market currencies. The yen on Wednesday plunged to its lowest level against the US dollar since August 1998 as hedge funds in Europe and the US resumed bets that the Bank of Japan’s ultra loose monetary policy would continue.
GBP has hit levels not seen since the 80s as inflation runs rampant and the government plans further relief packages.
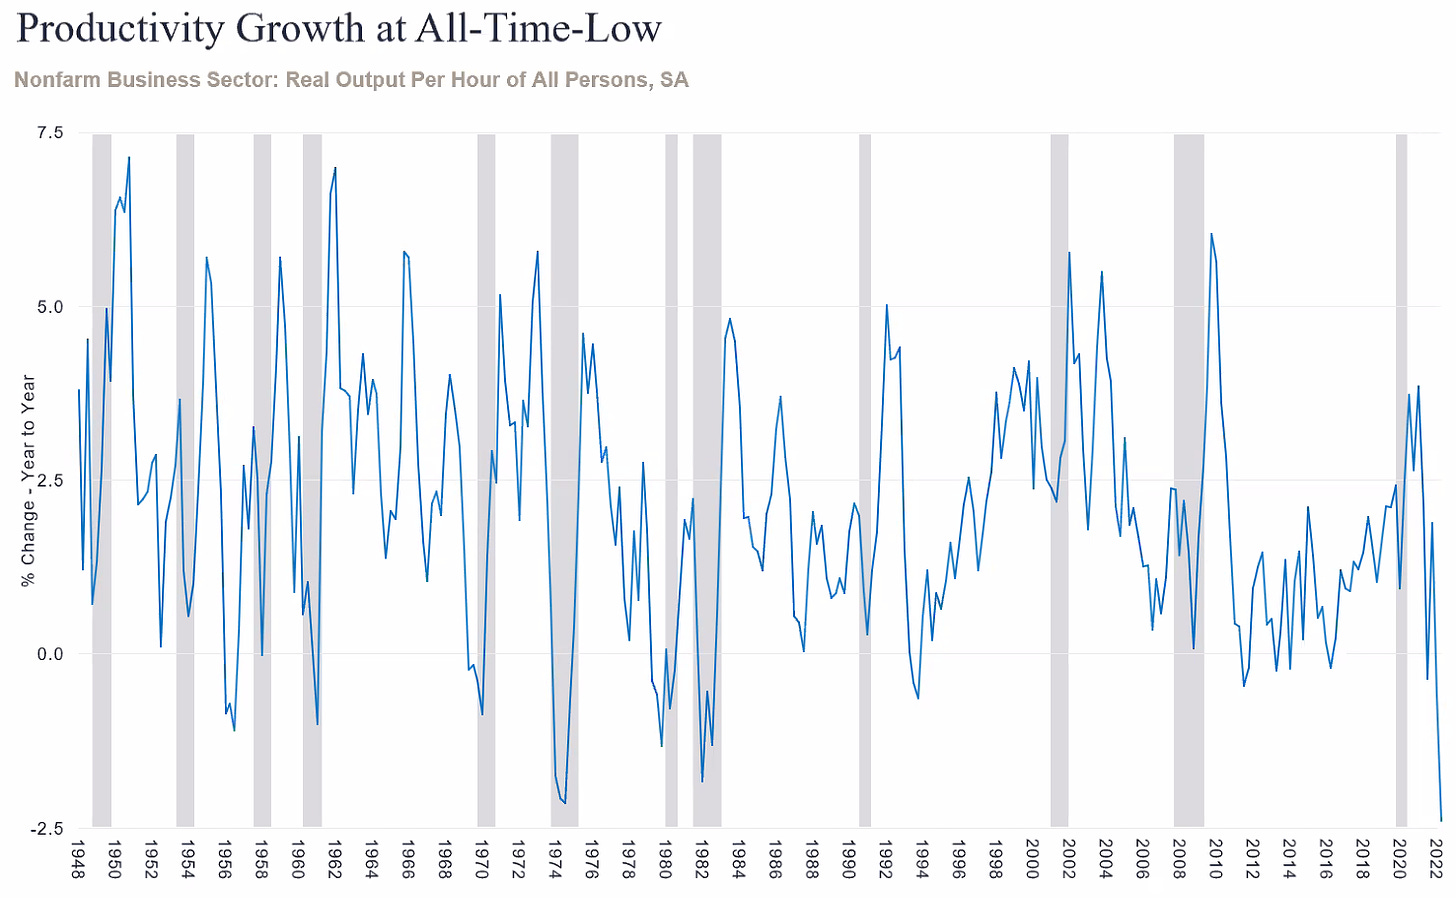
Productivity growth has collapsed as we emerged from covid in the US. Trying to figure out what caused this, my guess is it has something to do with all the stimulus pumped into the system.
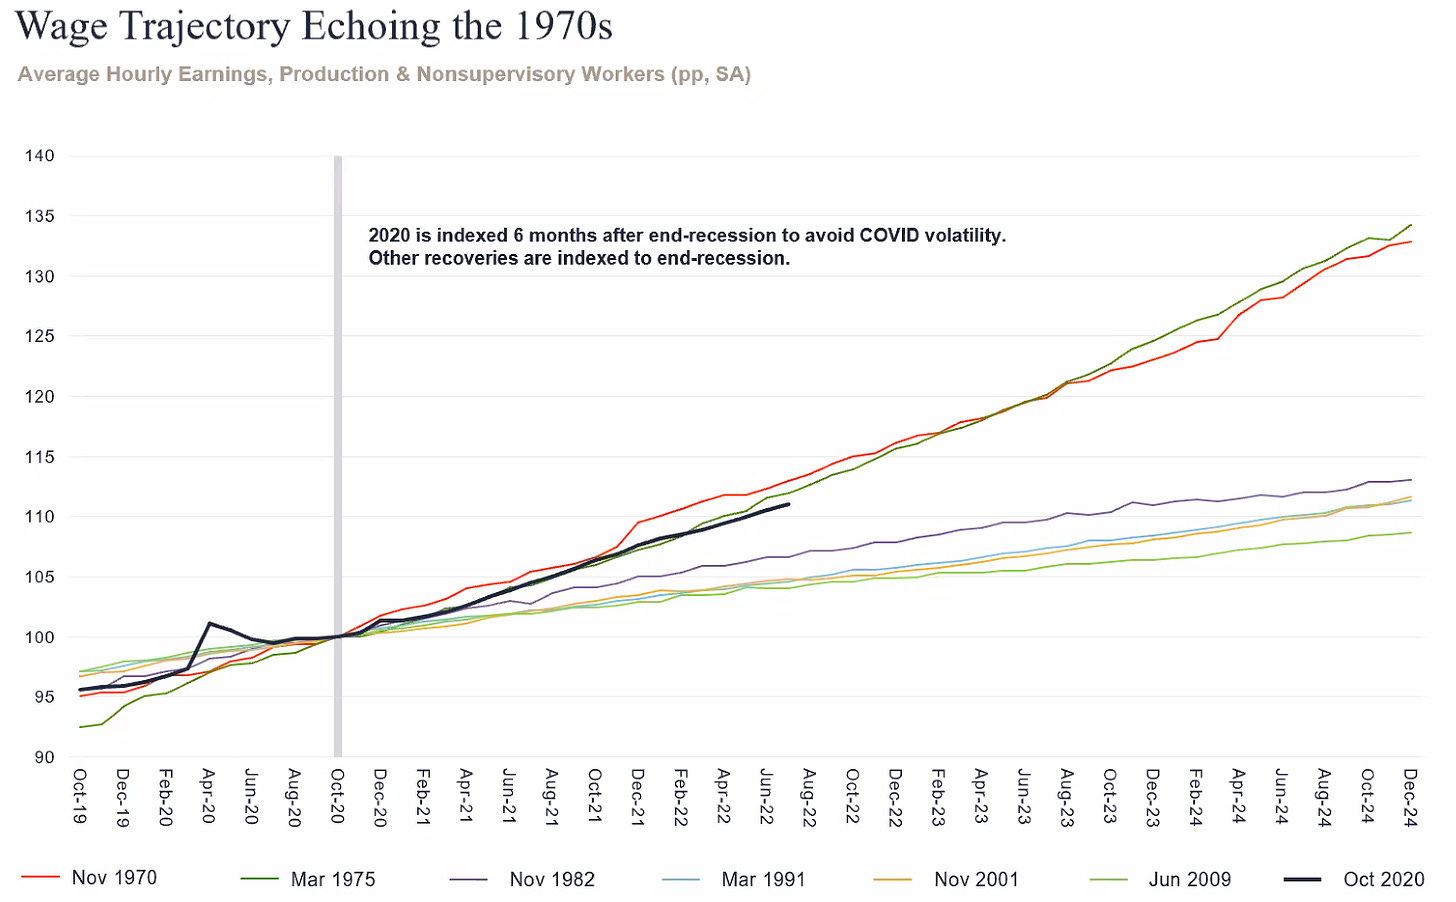
Chart visualizing wage growth across a cycle. We have not seen wages growing this fast in our careers. Wage trajectory is similar to ‘70 and ‘75. This might be the wage price spiral entrenched, not good for inflation.
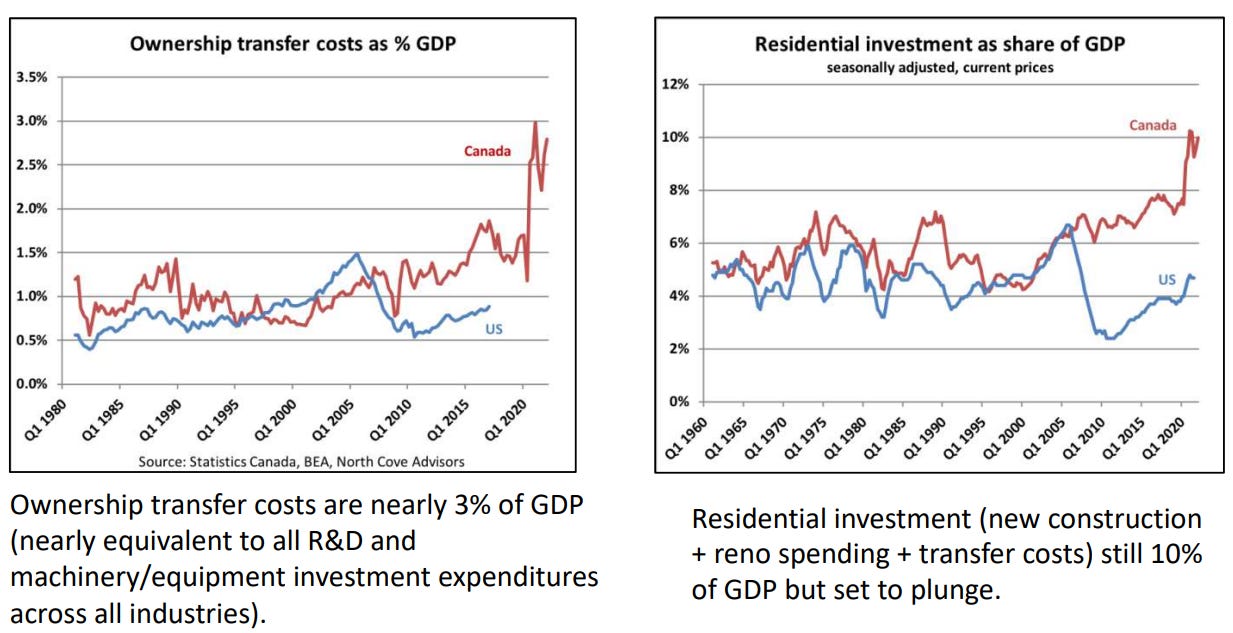
BoC raised their policy rate 0.75% to 3.25% yesterday morning. Rising rates had already caused house sales in Canada to fall off a cliff. The following charts are from North Cove Advisors.
The housing slowdown will have an impact on GDP as ownership transfer and residential investment are a meaningful portion of GDP. Incrementally, you will have not have investment financed by HELOCs.
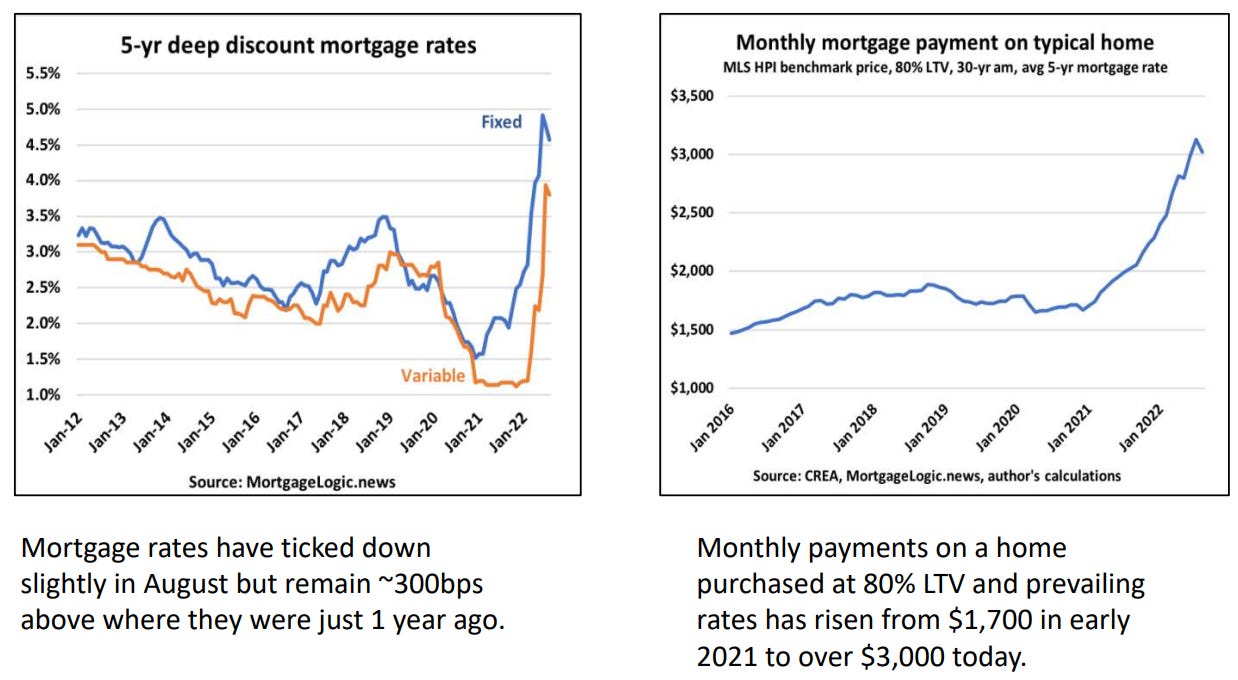
Mortgage rates have skyrocketed. This is prior to today’s rate hike and to blame for part of the housing slowdown.
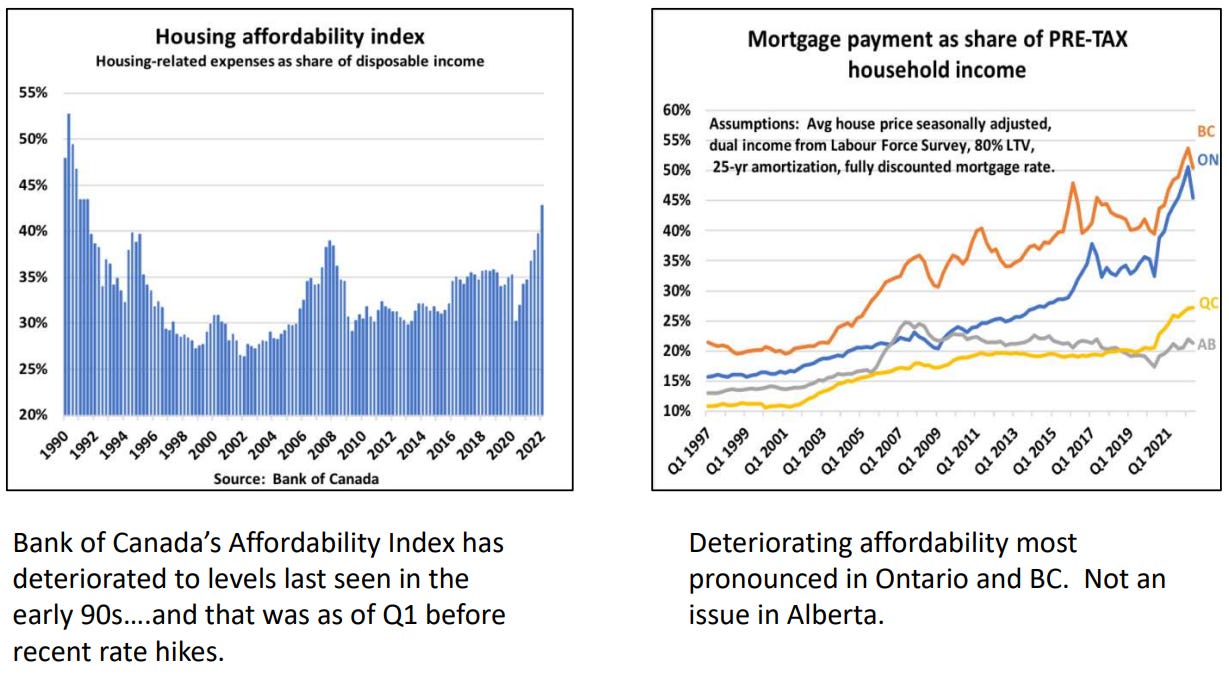
With rising rates at current prices, housing has become extremely unaffordable.
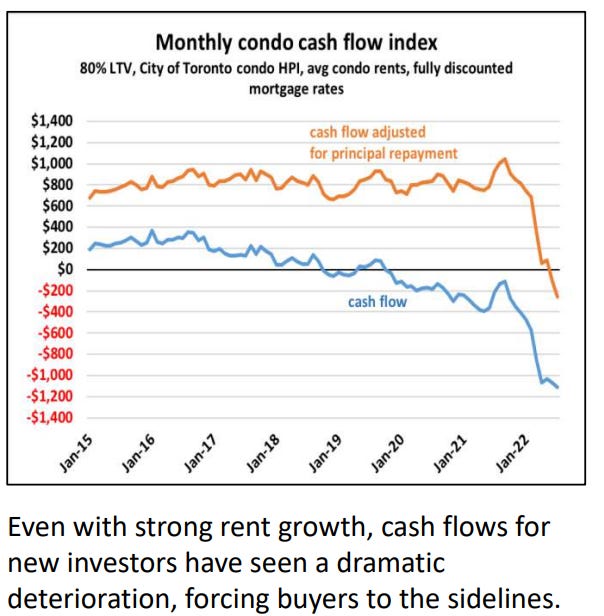
With rising mortgage payments, your average investment condo in Toronto is cashflow negative.
Listings are slowly rising but still significantly below pre-pandemic trends, this will provide some support for prices in the short term at least.
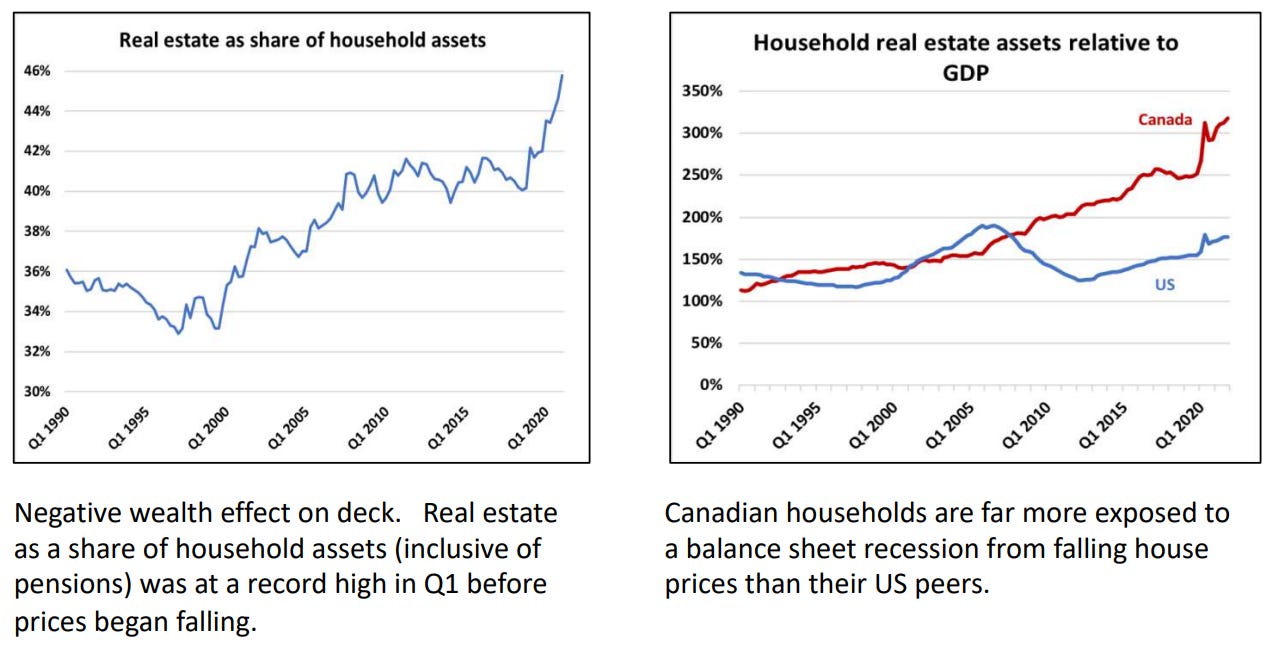
Real Estate remains very important to Canadian consumer’s balance sheets.
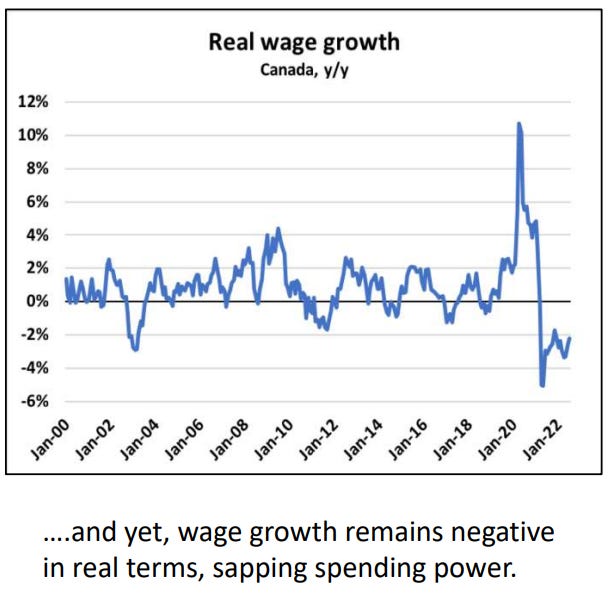
Wages are not keeping up with inflation, resulting in lost purchasing power.
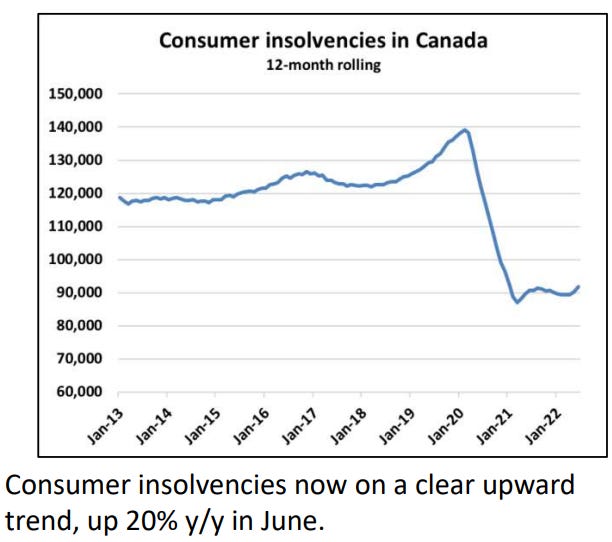
Consumer insolvencies have picked up but still significantly below pre pandemic levels.
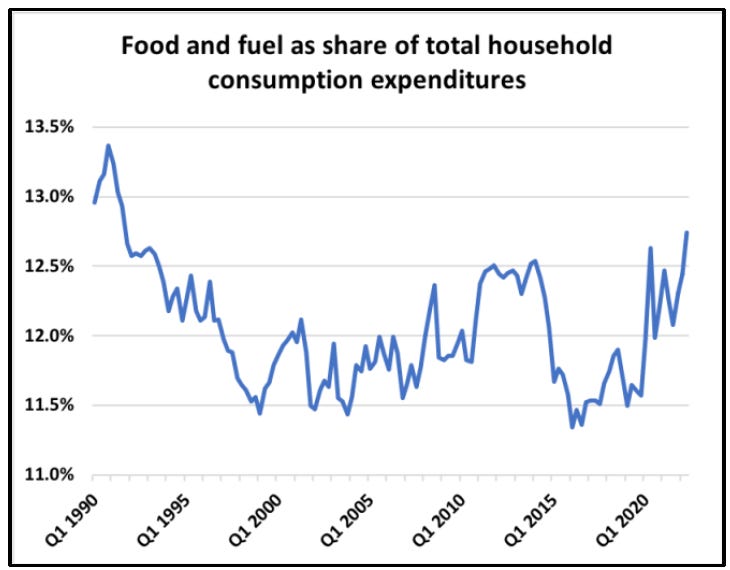
Food and fuel eating into household budgets.


