


Daily Charts - EPS & Fixed Income

Mike Wilson from Morgan Stanley continues to express concern over equity markets:
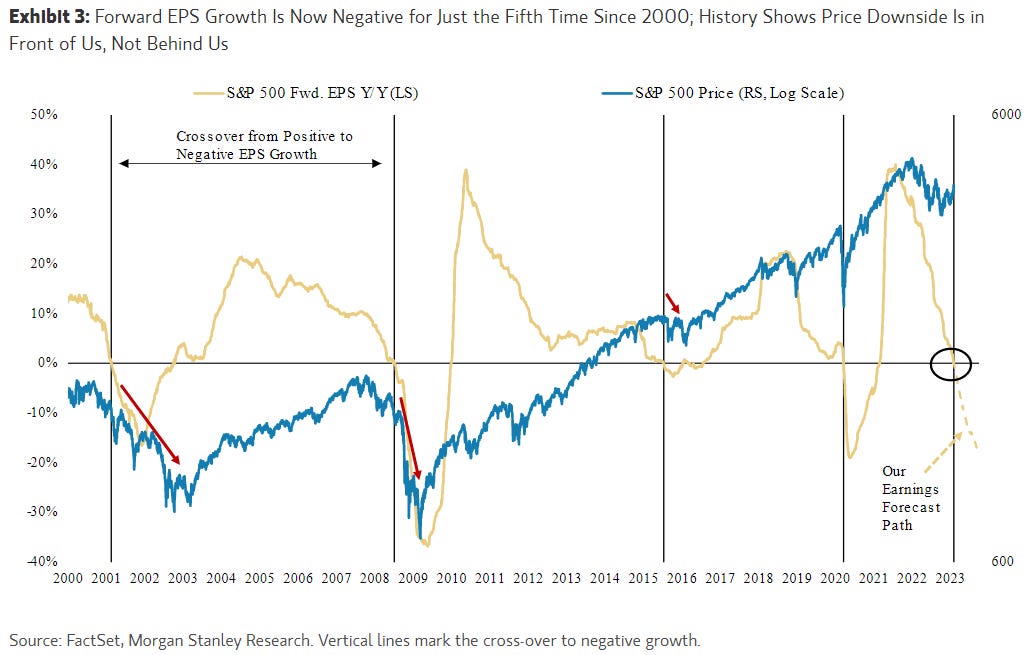
Forward EPS growth went negative last week. This has only previously happened 4 times over the past 23 years. In each prior instance (2001, 2008, 2015, 2020), equities have faced significant price downside associated with the shift from positive to negative earnings growth. What makes this analysis more powerful is that historically, the majority of the price downside in equities comes after forward EPS growth goes negative.
Q4 earnings are negative YoY for the first time since the Covid.
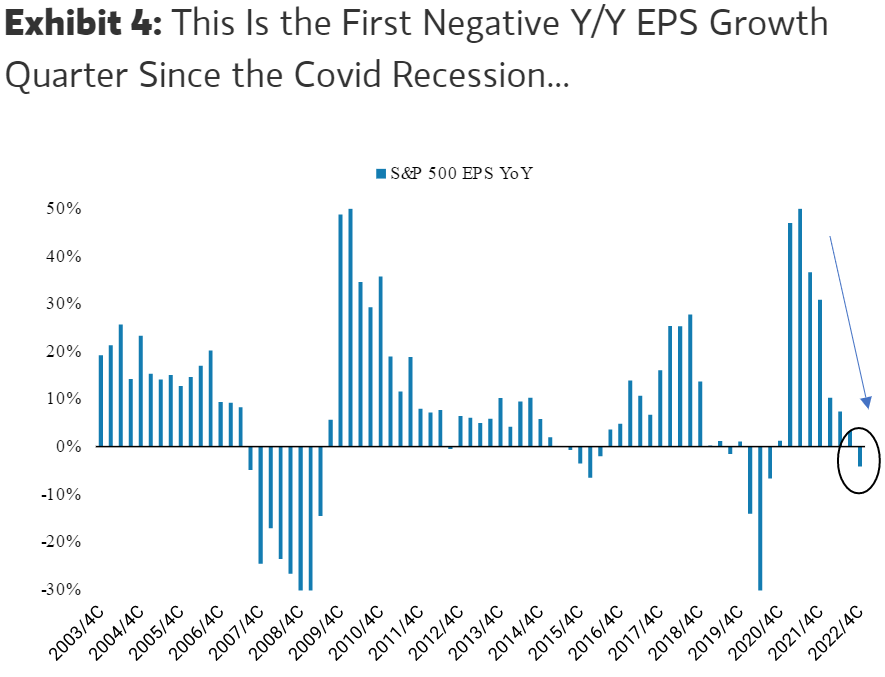
Additionally, EPS beat rate for the overall S&P 500 is just ~1% this quarter, also one of the lowest readings of the past 15 years.

Looking at S&P 500 forward EPS peaks in 2000, 2007, and 2020, they all occurred when Fed was either at terminal rate or already cutting rates. Rate hikes flowing through the economy causing earnings to roll over. This time, peak in estimates occurred when Fed was still in early phase of rate-hiking cycle.

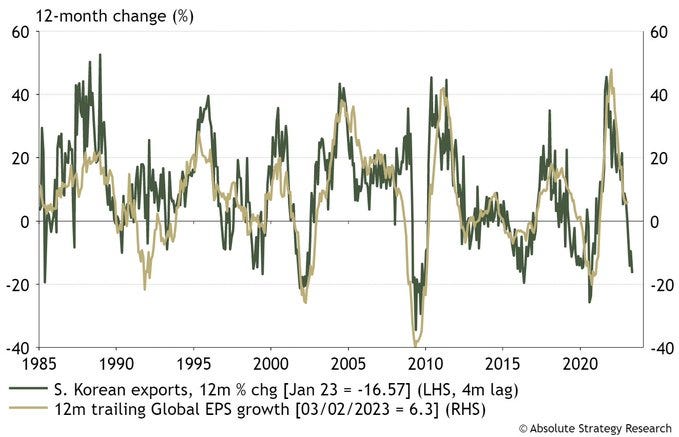
Another indicator for global EPS growth is South Korean exports. It doesn’t paint a pretty picture either.
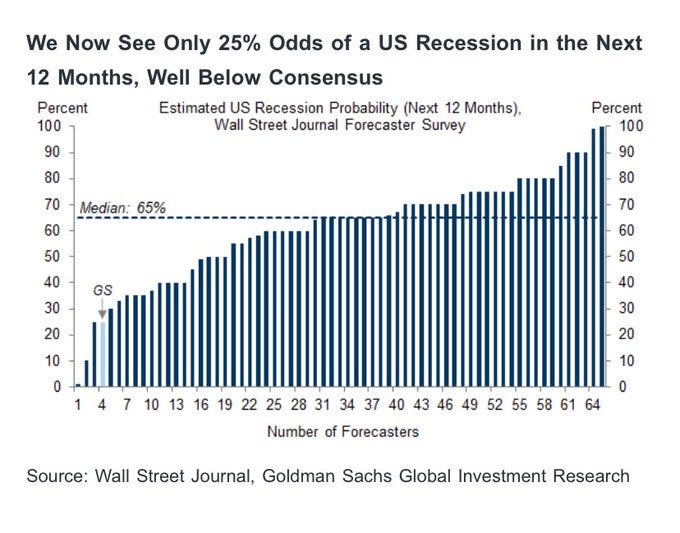
On the other hand, Goldman has cut their subjective probability that the US economy will enter a recession in the next 12 months from 35% to 25%.
Rob Arnott at Research Affiliates is forecasting with “high conviction” that inflation will reemerge as a problem towards the end of the year. This is just math has high MoM readings roll off from 2022.

Safe to say the situation remains highly uncertain. Although, I’d argue, market pricing doesn’t necessarily reflect this reality.
Now, looking at the bond market…
Joe Lavorgna, chief US economist at SMBC Nikko, looked at the six inversions since regular two-year Treasury auctions started in 1976
The average duration of these half-dozen cycles is 13 months. At present, the curve has been inverted for seven months beginning last July. Eventually, the curve must normalize because the financial system cannot function if the cost of borrowing exceeds the rate of interest on issued loans. Every time curve inversion reversed, it was the result of falling interest rates. Yields on both two- and 10-year notes declined, with the former falling more than the latter. In no instance did the curve un-invert because the yield on the 10-year note went higher. This is important because some investors speculate that the yield on 10-year Treasury notes will go up from their present level, perhaps matching or piercing last October’s 4.24% high.

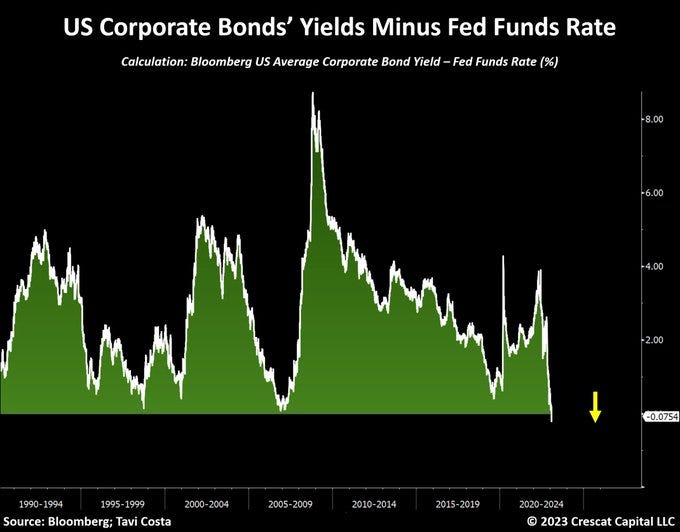
Corporate bonds yield less than the Fed funds rate for the first time in 30 years. This is arguably the most expensive part of today’s market.
The spread on ICE BofA US IG index tightened to 121 bps last week, inside the 90-130 bps range outside of shocks or recessions. The IG market is not pricing in trouble either.
.

BBB spreads are at levels typically only seen before all goes south.

Looking at yields across the fixed income ETF universe, you could own the AGG and clip 4.18% or not pictured below, make 5% in a Canadian High Interest Savings Account ETF. You are not being paid to take duration risk these days.

Travel is ticking up in China as the country reopens.

China is reopening faster than expected, this is one of the main reasons that underpin why Goldman thinks we may avoid a recession.

Hard to believe this was almost 35 years ago, could easily be today in Toronto RE.
