Daily Charts - Housing & Inflation
Main story from last week was inflation coming in slightly hotter than expected. Global markets were mixed. Markets are now fully pricing in another 75 bps hike in November.
CAD was off 1.1% WoW. 10Y yields in both Canada and the US were up in the low double digits due to the inflation data. Inflation hedges (Commodities, precious metals) were off.
Closing the loop on some charts from Friday, due to rising mortgage rates and unaffordability, mortgage applications in the US have collapsed to post GFC levels.
This is a good illustration of how affordability works. You can afford a lot less house, holding your mortgage payment constant, as rates have skyrocketed.
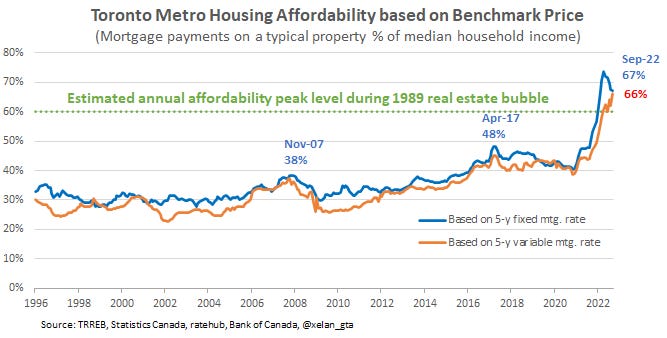
This newsletter had some good data on the state of Toronto housing. Unlike the US, supply in Toronto remains at low levels, this is good for prices.
However, we are subject to the same unaffordability issues being seen in the US. Again, mortgage rates or prices probably have to give at some point.
This is your bull case for Canadian housing.
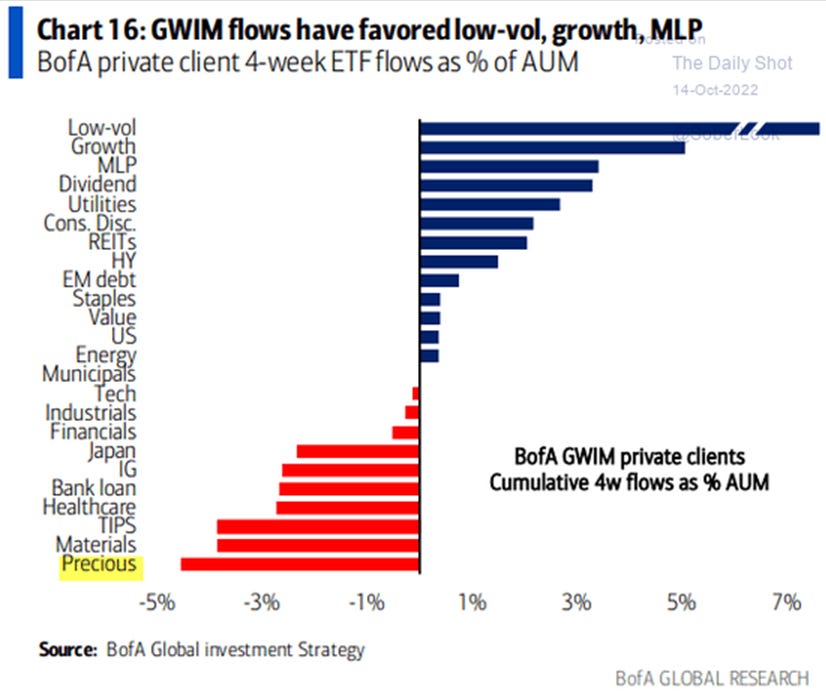
Merrill Lynch’s private clients have been cutting their precious metals exposure. They seem to be dumping inflation hedges. Inflows to growth suggest there is some BTD behavior.
Great interview with Russell Napier. He continues to bang the “financial repression” gong.
To his point, it will be difficult for the West to get out of this debt trap. Historic ways to reduce debt are austerity + taxes, grow your way out, or inflate your way out. The below is from Apollo:
The level of government debt outstanding limits how much the Fed can raise rates. With total debt held by the public at $24.3trn, the 2% increase in the entire yield curve over the past six months will increase debt servicing costs by $486bn, see chart below. With net interest expenses expected on government debt in FY2023 at $442bn, the total annual debt servicing costs would rise to roughly $1trn. The bottom line for markets is that rising interest rates are becoming a significant drag on US GDP growth. For more, see also links here: Debt to the Penny, Interest Expense on the Debt Outstanding and CBO projections.
Swapping Zillow’s rent index into core CPI vs owner’s equivalent rent would have resulted in core CPI levels hitting 16% in 2021. This would have caused panic.
Inflation is crushing real weekly wages.
Expect to see more headlines like this, coming to a country near you, if real wages continue to be eroded. This is how inflation becomes entrenched.
Woops…


