Daily Charts - Inflation
Yesterday we got disappointing US CPI numbers:
Headline at 8.3% v/s 8.1% expected, 8.5% prior
Core at 6.3% v/s 6.1% expected, 5.9% prior
This chart shows why this CPI number is so disappointing. The contribution of energy has declined, as expected; but services inflation is now rising sharply.
Of 4 inflation methodologies, only headline inflation fell in August.
The market began pricing in a 48% chance of a 1% hike at the end of the month. A month ago, the market was only pricing in a 50% chance of a 0.75% hike.
This sent risk assets spiraling downwards. Nasdaq was down more than 5%. S&P 500 had it’s worst day since June 2020.
Apple’s market cap fell by $154 B. One of the worst single day market cap drops in history.
It wasn’t until the war started, did yields shoot up.
Should we be relying on inflation expectations from professional economists, when they have assumed the Fed would control inflation at 2% for the past 20 years. Sounds like it was the easiest job in the world for 2 decades
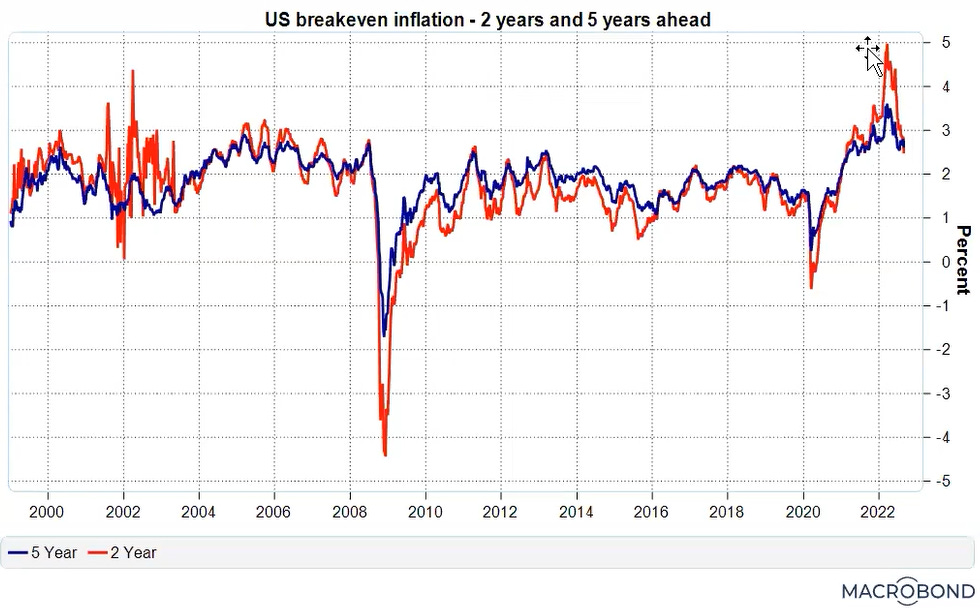
Even market based inflation expectations, they briefly shot up but quickly began normalizing towards 2%.
History argues that negative real rates won’t tame inflation. We shouldn’t be shocked if these slow hikes don’t do the job.
Historically, a recession was required to reduce inflation by more than a point or 2… Europe could be ok, UK should be ok, as they both head towards recessions but no signs of a recession in the US.
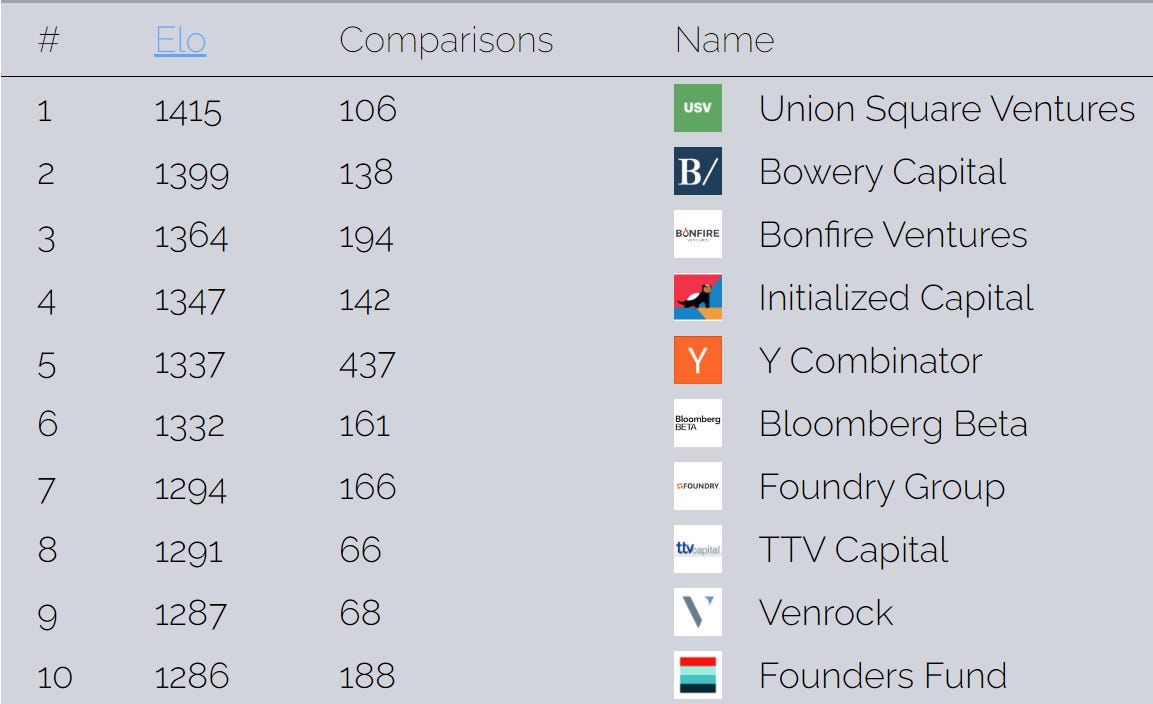
List of founders’ preferred VCs as voted by 338 founders.
European energy prices are slowly coming back down to earth.
This will fall as energy prices fall but if energy prices did not subside there would be a massive burden on the economy.
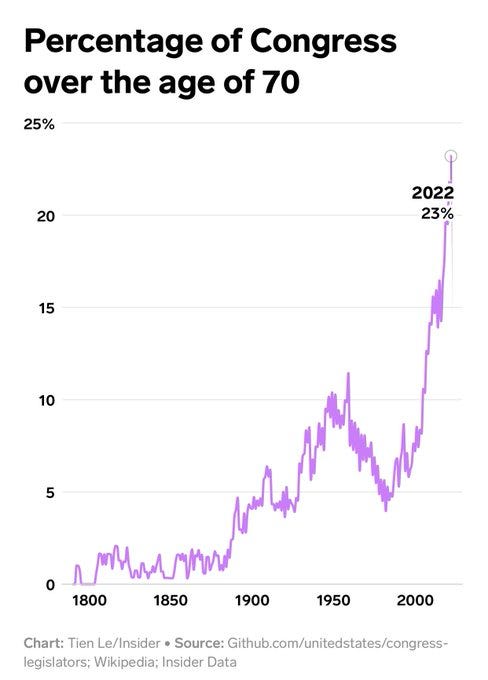
Congress has become a retirement home!


