


Daily Charts - Inflation Day

The robots are coming (Link).

KKR took Envision private in 2018, it looks like they will be writing off their $3.5B equity cheque.

Bankruptcies are starting to tick up.

2 Follow-ups from yesterday.
Mortgage rates or housing prices need to fall. This isn’t sustainable.

Excess savings are continually cited as a reason the economy has been resilient. Nobody has a great grasp of when these will be exhausted.
In a report released last Friday, Robert Sockin of Citibank reiterates a key point. To derive an estimate of excess savings, and therefore households’ extra spending power, the Fed has to make an assumption about what the underlying trend in household savings is. “Excess” savings, in other words, only makes sense in the context of a “normal” savings trend. The Fed used the savings rate from the period 2015-2019, of about 9 per cent, to model that trend. This implies excess savings at about $1.1tn, or 4 per cent of GDP. But if you make a lower trend savings assumption, excess savings and spending power are higher and falling more slowly. Sockin’s punchline is that in 2015-19, savings were abnormally high, so we might want to adjust the Fed’s estimate for excess savings up.
Here is his graphs of the savings rate and the estimated stock of excess savings. “Citi scenario 1” assumes an 8 per cent trend savings rate; “Scenario 2” assumes 7 per cent. These scenarios result in very different estimates of when America’s extra savings will be exhausted.

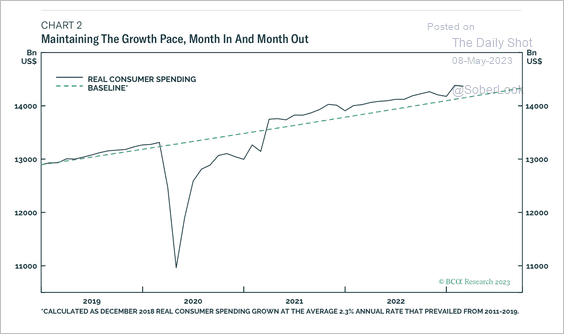
As mentioned, there has been no slow down in consumer spending, propping up the economy.
Visual representation of how divided society is right now.

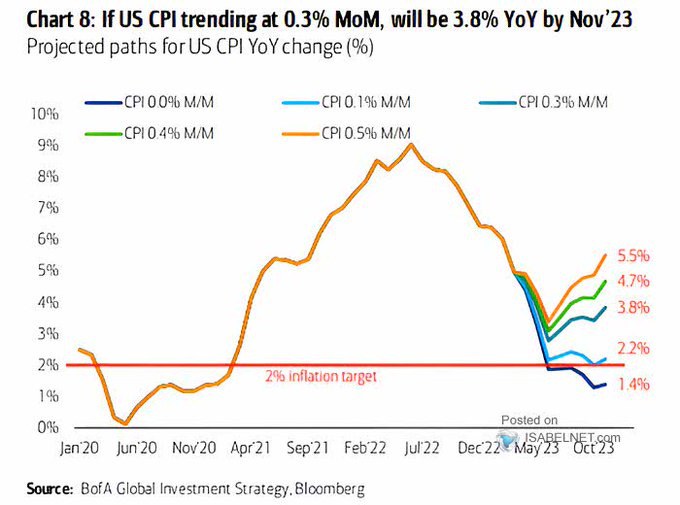
Inflation is expected to fall to 5% tomorrow in the US. It is expected to continue to fall through June due to base effects.
Inflation surprises have consistently been falling.

The two-year inflation breakeven (derived from the difference between inflation-protected and fixed-income bonds) suggests that inflation will average almost exactly 2%, the Fed’s official target, into the first half of 2025. It’s worth remembering, though, that breakevens can be wrong, particularly in the bizarre conditions created by the pandemic, which have made fools of us all. This chart shows the two-year breakeven and the actual consumer price inflation number with a two-year lag, so at each point it compares the bond market prediction with the actual outcome. The peak in inflation, above 9%, came almost exactly two years after breakevens had suggested that there would be outright deflation by that point

Here are the meeting by meeting levels being priced in. Markets now see a 31% chance of a rate cut in July. The base case shows three 25 bps rate cuts this year beginning in Sept.

Before we celebrate…
Average hourly earnings rose by almost 0.5% month-on-month in April, which is right at the top of the normal range (the following chart excludes the two or three extreme months from the pandemic in 2020 for legibility). This isn’t evidence of a terrifying “wage-price spiral”; but it certainly doesn’t suggest the Fed will feel comfortable to relent on rates any time soon.

Due to the inflation and economic uncertainty, it still isn’t clear which way rates are going to go. The case for higher and lower rates below.

This is leading to extreme volatility in fixed income markets.

Everything physical is made in Asia.
