


Daily Charts - Inflation Recap

The all items index increased 6.4% for the 12 months ending January. The MoM number was not encouraging, annualized it would still be above 6%.

The index for shelter was by far the largest contributor to the monthly all items increase, accounting for nearly half of the monthly all items increase, with the indexes for food, gasoline, and natural gas also contributing.

The CPI print sent a Treasury yield (6 month) above 5% for the first time since 2007.

Compared to June, progress is being made but we still have a long way to go.

At one point, we were looking at shorter term data for signs of inflation slowing but that reversed in January. The 3 month annualized Core CPI was up to 4.6%, and a 5.3% six-month annualized rate.

Headline CPI was up at a 3.5% three-month annualized rate in January, and a 4.1% six-month annualized rate.

The shelter component of CPI just had its highest 2-month increase in 33 years. This doesn’t bode well for Canadian CPI, I’d argue the shelter component in Canada will probably be stickier due to the tight housing supply.

Nominal wage growth is starting to move higher again despite the deceleration in inflation.

On the bright side, we are not Argentina. Argentinian inflation hit 99% YoY in January.

Unfortunately when we take a step back and start looking at price levels, an ugly picture forms. After the dust settles from a major event, whether inflation was just caused by temporary supply shocks or by monetary debasement is answered by one key test, are price levels higher than they were before the “transitory shock?”
Looking at WWII, price levels settled permanently 90% higher.

The inflation beginning in the late 60s/70s saw price levels increase by 237% over 20 years.

Despite inflation slowing and the “transitory shocks” alleviating, everything costs more.

Wages have not kept up with inflation, the average worker takes home less than they were before the pandemic. The general population is poorer because of permanently higher costs.

The price of a can of Campbell’s soup over the past 100 years is another way to look at it.
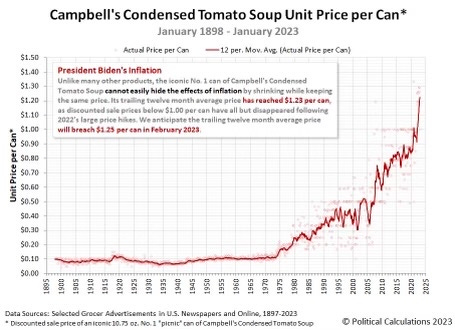
Inflation has hit the lovers hard over the past year.
