


Daily Charts - Stocks Take Off 🚀 & Jobs

Wednesday was a turning point, the market interpreted the Fed meeting, a slew of weak economic data and the Treasury funding data as the Fed pause, paired with easing financial conditions. Markets reacted enthusiastically with the S&P 500 posting its best week since Nov. 2022. The most interest rate sensitive areas of the market, real estate and speculative tech (Ark) led the way. Ark was up a whopping 17% in CAD terms.

10Y yields were down roughly ~25 bps in both Canada and the US, resulting in a strong week for fixed income. Crude down more than 5%, leading commodities lower provided further relief. Bitcoin and Ethereum had strong weeks but noticeably weaker than speculative tech as crypto continues to diverge from trading like a tech asset. CAD gained 1.6% on USD.

Rough economic data points all week have led to markets pricing in a cut in March 2024.

US jobs numbers were released on Friday. The US added 150k job (180k expected). Most of the additions came from Government sector jobs and healthcare.

The unemployment rate ticked up to 3.9%. The trend is concerning and approaching an increase that normally coincides with the beginning of a recession but we are also rising from historically tight levels.

You see here, rises in unemployment coincide with recessions. Still early days.

Canada added 17.5k jobs (25k expected) in October. The Canadian unemployment rate rose 0.2% to 5.7%, up from 5% in April. Rising but again, from historically low levels and we are still below the long term average.

Trying to piece together what happened last week, Andy Constan has been nailing the liquidity driven market regime. He thinks the following:
Treasury funding plans ease financial conditions, the Fed cited higher long term rates as a reason to be more conservative, “Long term interest rates have done some of the work for us.” Last week undid much of that, he now believes a December rate hike is back on the table as the Fed has more work to do to slow the economy now.
Tightening ultimately needs to come from the long end of the Treasury curve.
Recession is delayed as financing costs fall, it will be a better Christmas.
We are going to get weak data for the next 2 months because of the 100 bps 10Y rise in Q3. The Fed will have to be thoughtful enough that now easing financial conditions will improve Q1 data and if they delay tightening, they will have to hike more and faster, once again.
Increasing bill issuance exposes you to refinancing risk and the term premium is still negative so issuing bonds still made sense but the actions from the Treasury are not completely irrational, there is a way out.
Market participants will realize the recession has been pushed out.
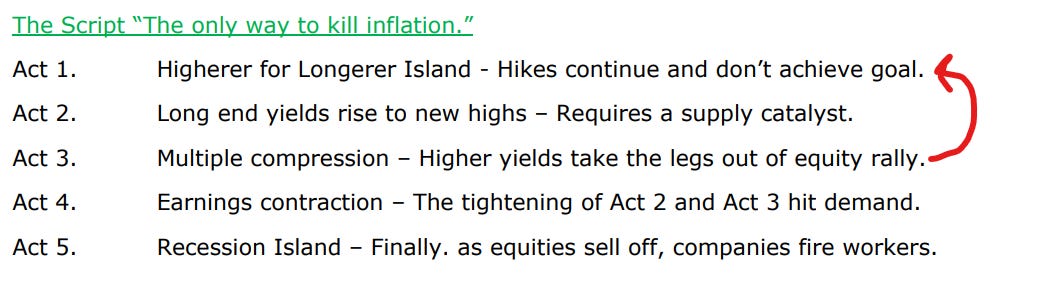
This is his framework, he thinks we moved back to Act 1 last week. We are back in higher for longer, only way to get demand down is through firing workers, which won’t happening because conditions are easing again.
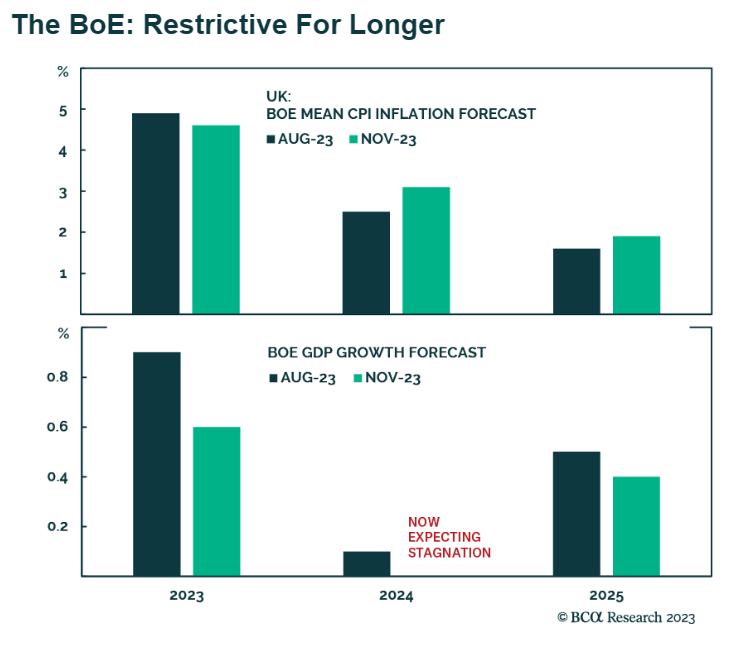
I think this could actually be bad news for highly indebted areas of the market. Higher for longer and more Fed hiking means countries that are already struggling will have to wait longer for the Fed to cut. The Canadian, UK and European economies are already feeling stagflationary pressures and may be forced to diverge from Fed policy likely resulting in weaker currencies.
No relief for Canadian real estate yet. This article details some of the pain in the GTA.

Some areas have round tripped back to prices seen at the beginning of the pandemic. A $460k loss in 1.5 years excluding fees and taxes, no equity left and then some.

Canadian real estate is out of bubble territory after the recent price retreats according to UBS but that doesn’t mean higher for longer rates won’t wreck havoc.

The below is from Carlyle, high debt costs means cashflows need to be allocated to servicing debt reducing the return for equity investors.
The charts below assume you are underwriting a 20% return target in private equity
The left chart depicts a 60% debt/40% equity PE model when base rates were 0%
By simply paying down your debt, your cash yield to equity would generate an 11% return
That means you would on require 9% earnings growth to get to your 20% return target
The right chart depicts the same model in the current rate environment
Paying down your debt only generates 4% in cash yield to equity
That means you need to generate 16% earnings growth to get to your 20%
That also doesn’t include the added risk premium that should be added for the higher cost of debt

Howard Marks goes into the credit vs equity dynamic further. If you can generate a double digit, contractually driven returns in credit markets, above the long term average of equity markets and equities will have to allocate more capital to servicing debt reducing returns; credit could outperform. Albeit, if defaults are minimized in these riskier credits. The challenge for taxable investors is the tax treatment of credit and fixed income is quite punitive.