Daily Charts - Stress in the System 🏦
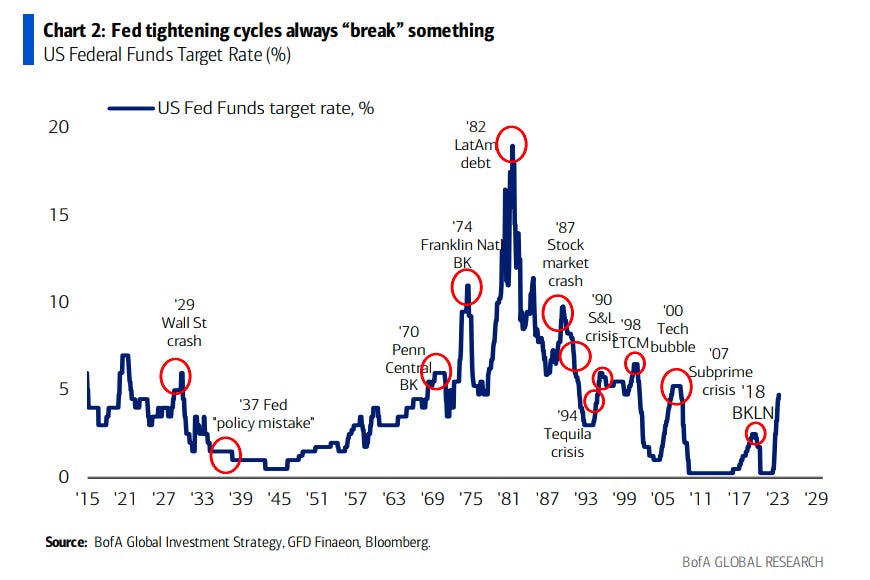
Resurfacing an old chart but important chart, I worry that our overly indebted economy can’t handle higher rates.
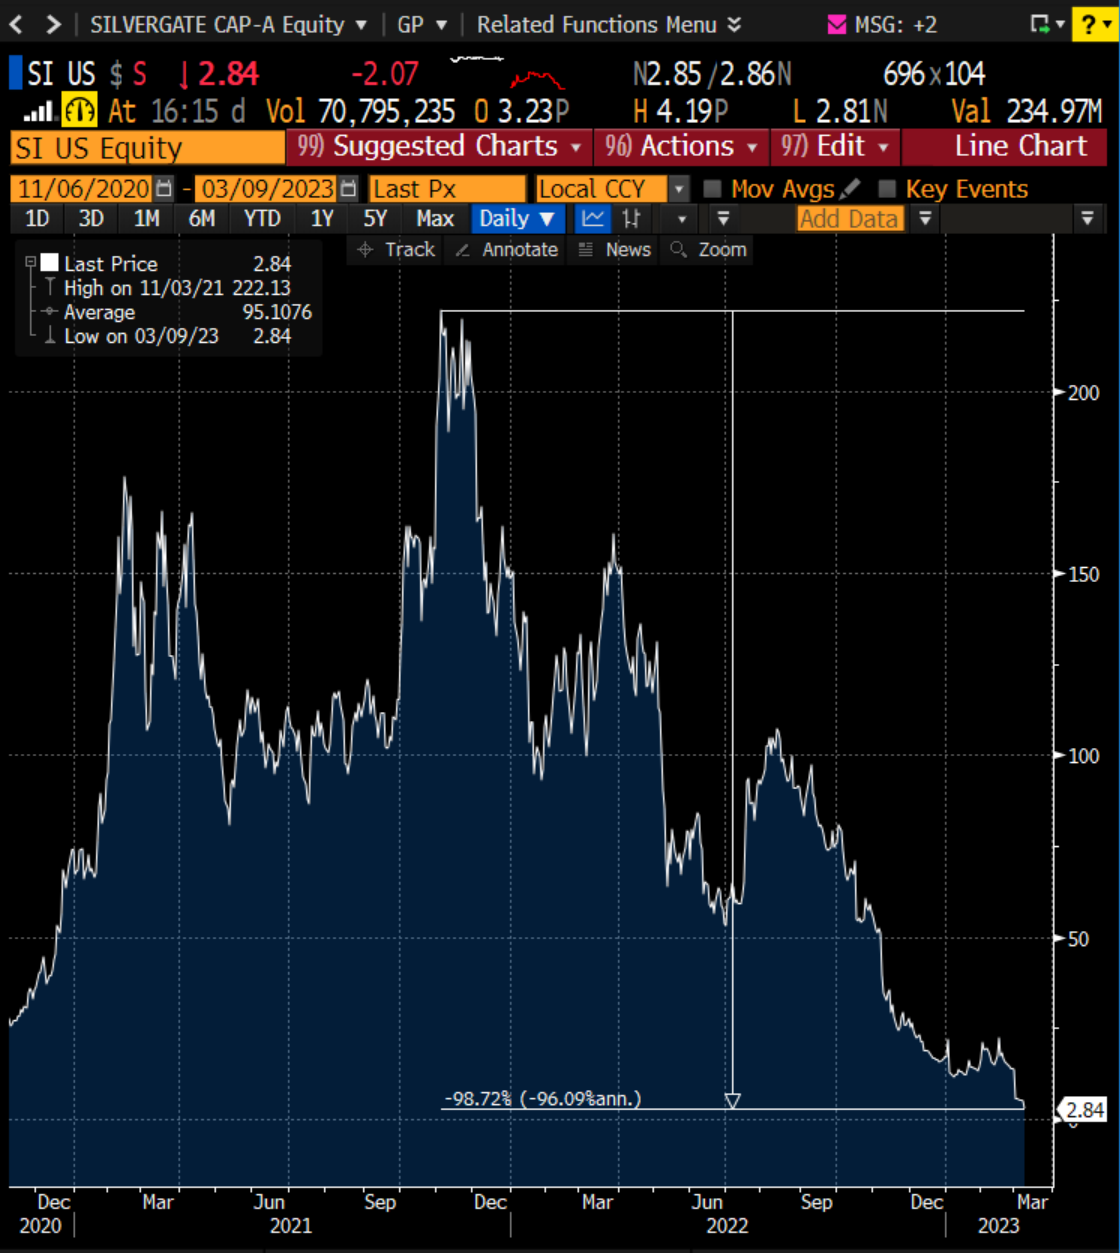
We are starting to see signs of stress within the regional banks. Earlier this week Silvergate Bank announced they would be liquidating. Down 99% from just over a year ago. This was brushed off as they primarily dealt with the crypto industry.
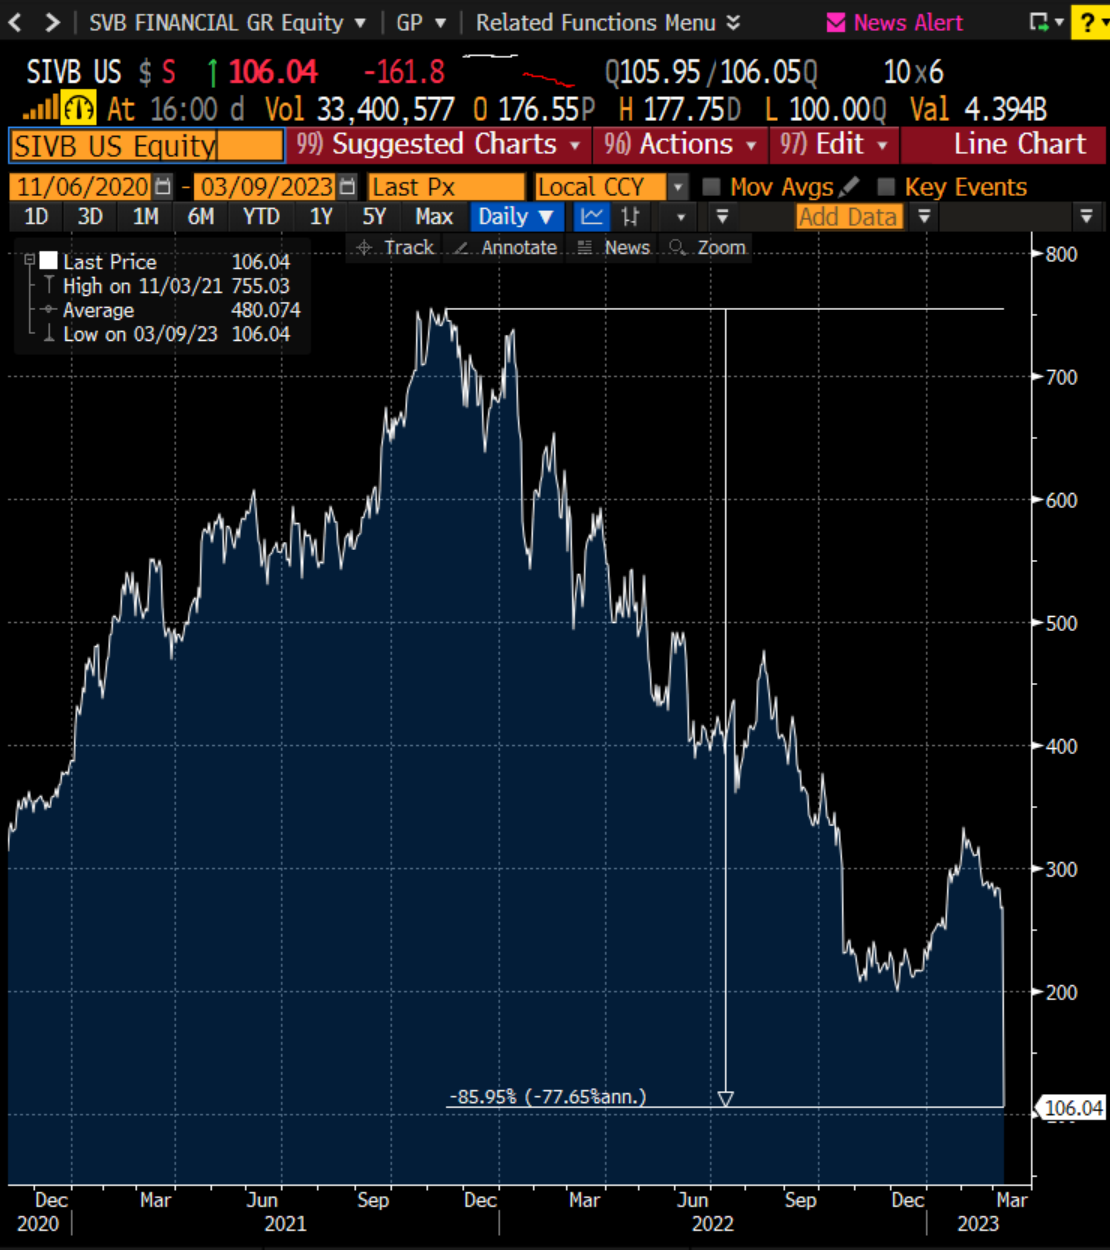
The next shoe to drop, Silicon Valley Bank down 60% yesterday.
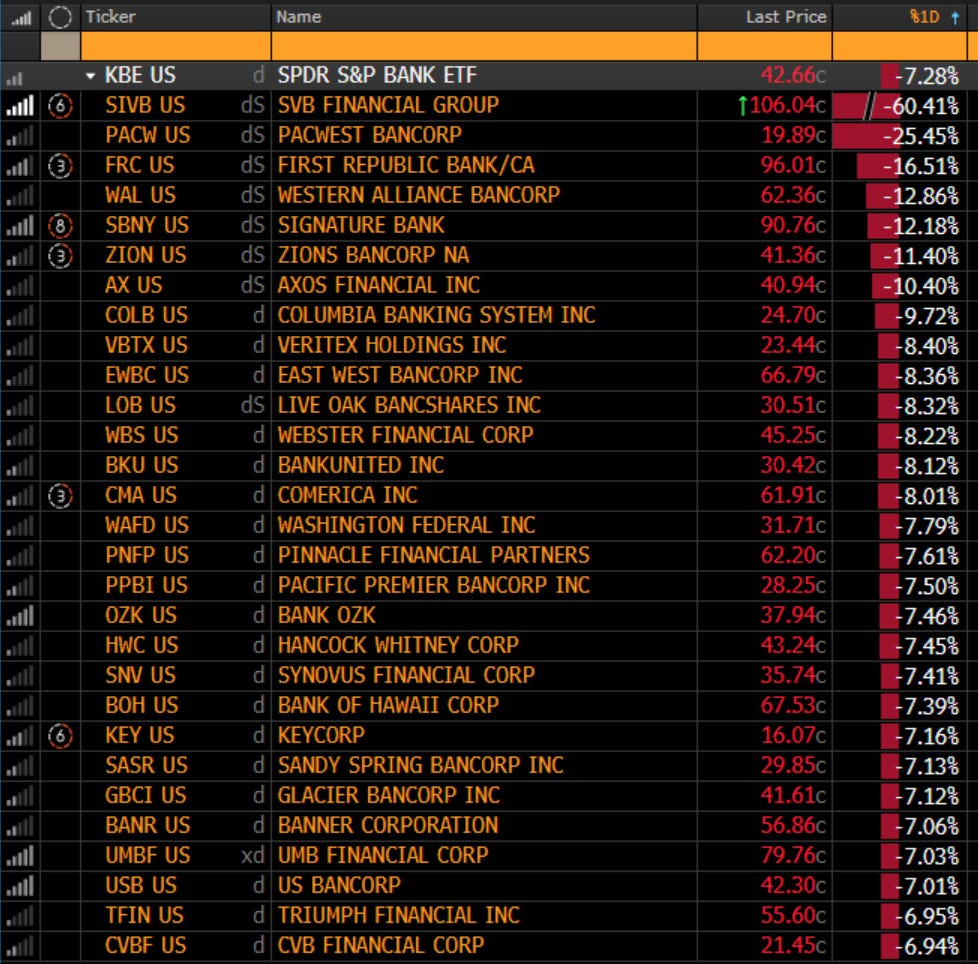
The S&P Bank ETF was down 7.3% yesterday. Pain across the entire sector. SCHW 0.00%↑ was another big name down big. These are things that probably shouldn’t happen in a healthy market.
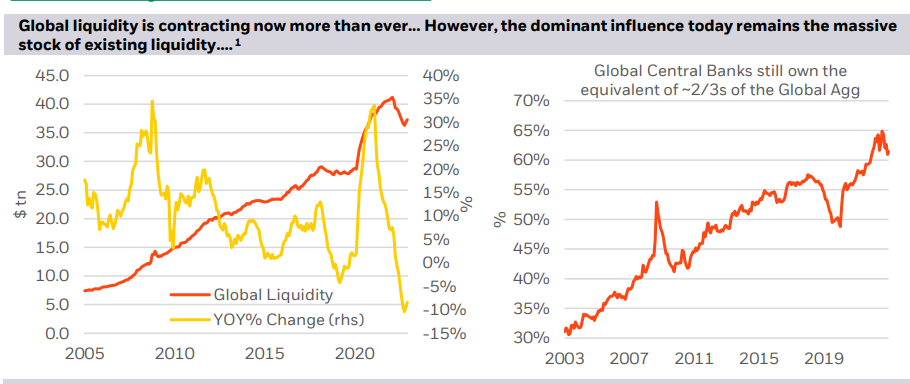
At the same time, the financial system is still awash with liquidity. I’ve seen the contraction in M2 flagged a few times but in absolute terms, there are still trillions of additional liquidity in the system vs pre pandemic.
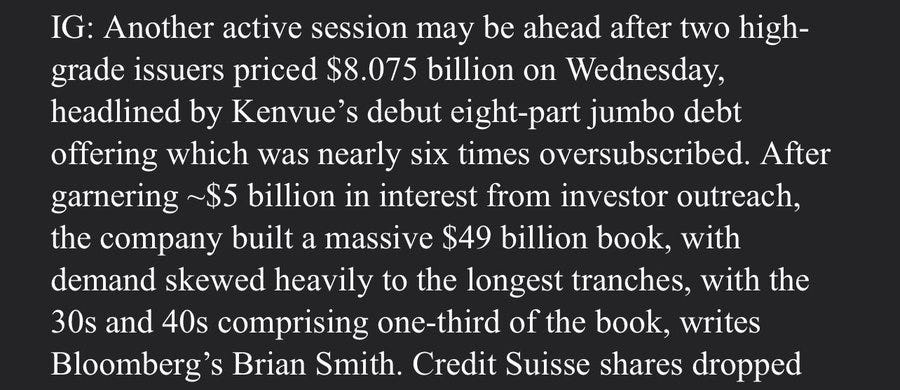
A sign of the liquidity, Kenvue, J&J’s consumer business spin-off debut bond offering was 6 times oversubscribed.
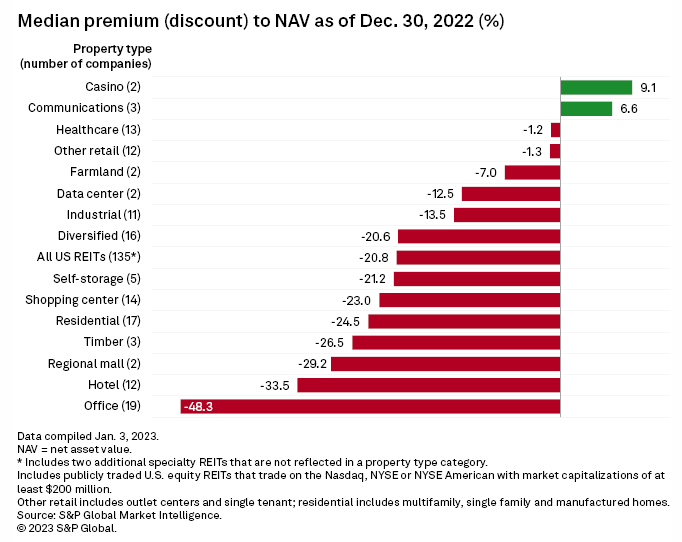
REITs continue to trade at major discount to their NAVs, office unsurprisingly is in the most pain.
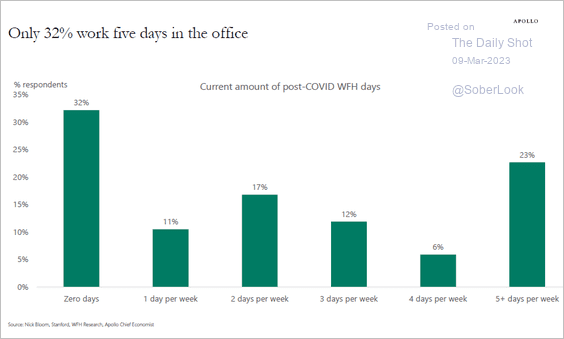
Only 32% of those surveyed are in the office 5 days a week.
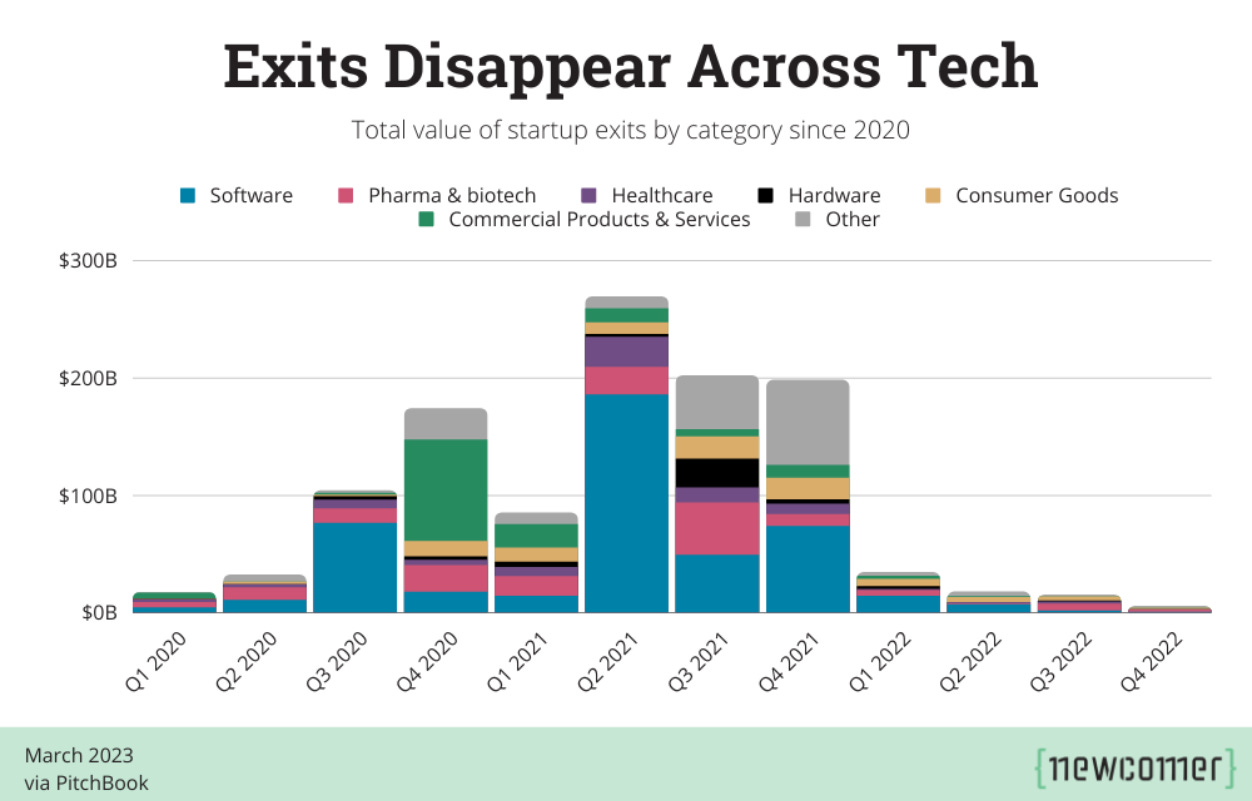
The exit window for venture capital backed tech has completely evaporated.
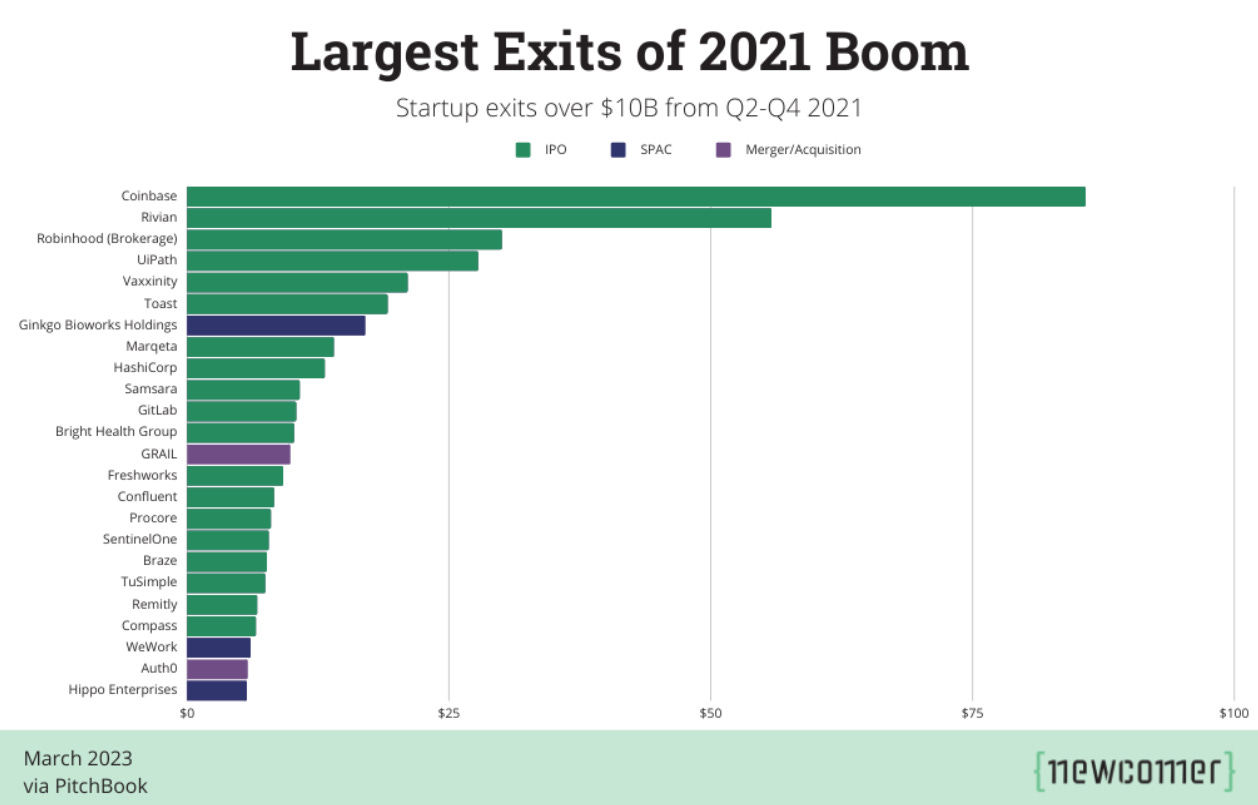
Coinbase was the biggest start-up exit of 2021.
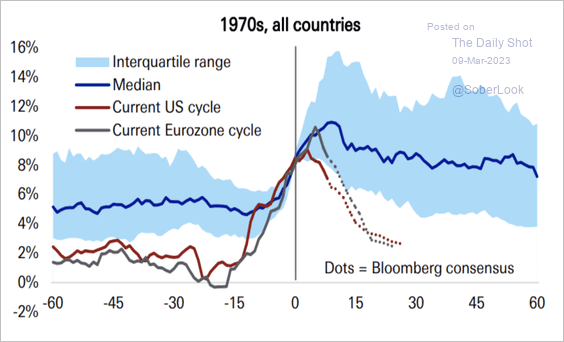
A reminder that inflation expectations may be optimistic. In the 70s, it took inflation much longer to normalize.
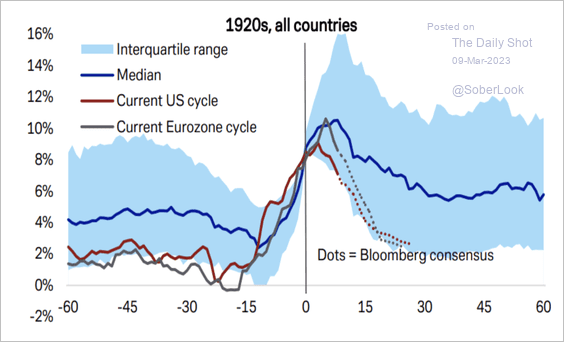
Inflation of of 1920’s, current forecasts represent a top quartile outcome.
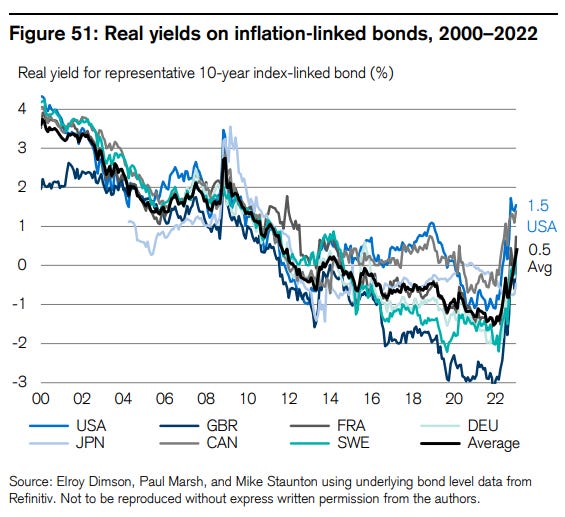
Real yields aren’t what they used to be, this can be though of as a general barometer for lower returns across all assets as investors now accept a lower real risk free rate.
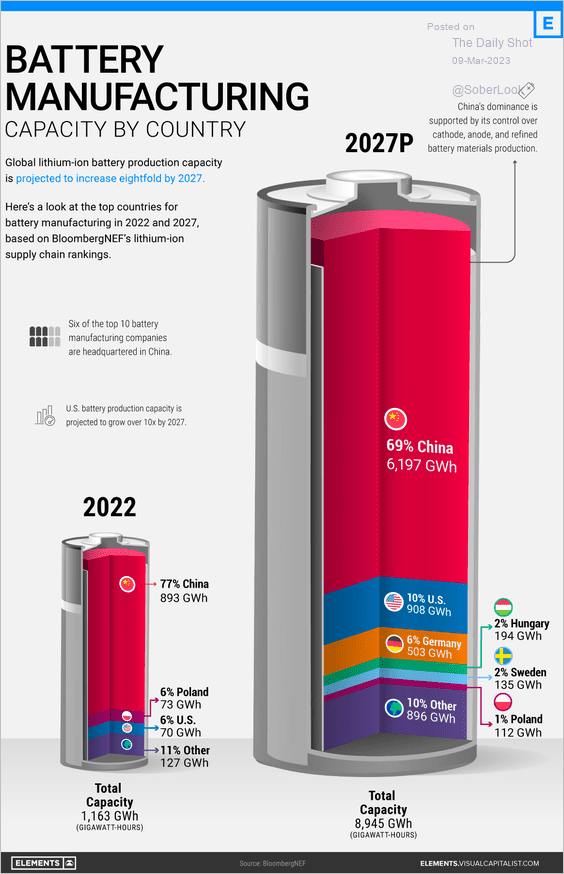
The US is on track to dominate LNG exports, China is set to dominate battery manufacturing. We should be thinking about energy security after what happened to Germany over the past year. We shouldn’t become dependent on adversaries for our energy.


