Market Concentration

The market and discourse is increasingly dominated by the largest stocks in the US. These stocks have gone on an amazing run but can it continue? This has been a headache for active managers. Does Technology allow these massive companies to generate outsized profits? When will the biggest companies be disrupted? The biggest implications are for passive investors who are increasingly making an active decision to concentrate into the US’ largest stocks. MS Counterpoint had piece on stock market concentration and I have some complimentary charts below.
Another year of the largest stocks outperforming the rest of the S&P 500.

This trend has been ongoing since 2020, excluding a small hiccup in 2022. Compared to your average US stock (Equal weighted Russell 2000) that is slightly up since 2020, the Mag 7 have 4xed.
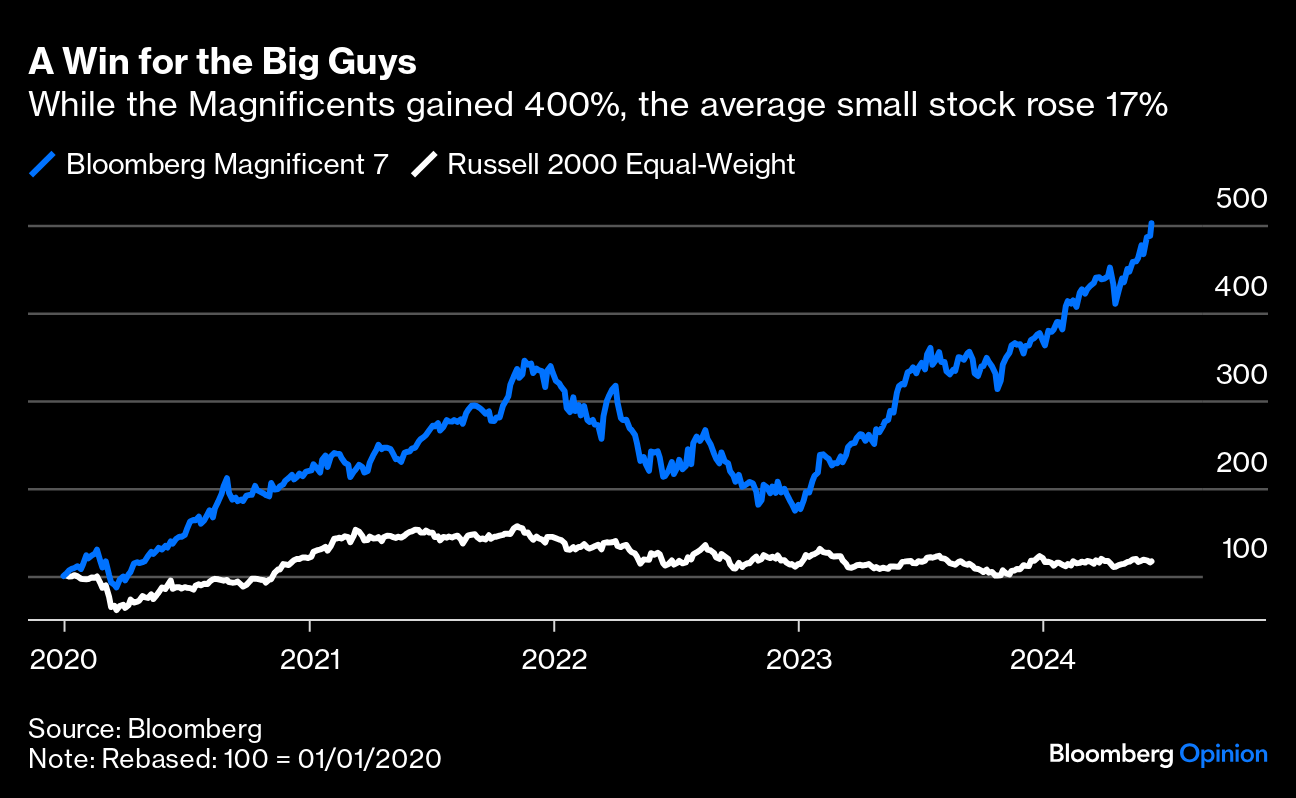
As of late, it hasn’t really been the Mag 7 but Nvidia’s world and we are just living in it. It took Nvidia 30 days to add $1T of market cap.

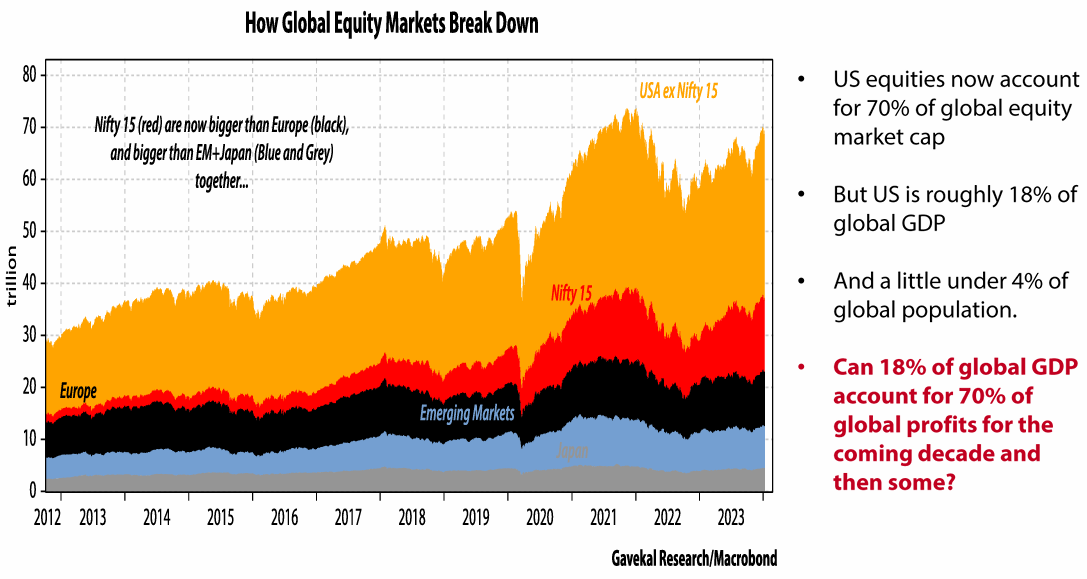
The relevant question for investors is whether the top stocks will continue to outperform the rest of the index causing the ever concentrated index to outperform. The US market is roughly 70% of global market cap, about 4% of the world’s population and only 18% of global GDP. To justify the large share of global market cap, these companies need to capture a similar share of global profits over the coming decade.
The Magnificent 7 are larger than any other countries total market cap.

The 3 largest stocks are each larger than all 2,000 stocks in the Russell 2,000.

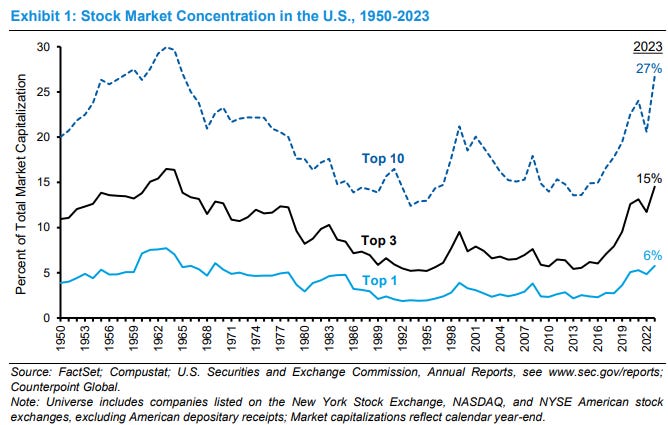
The top 10% of stocks in the US are 75% the size of all other US stocks. Concentration levels not seen since prior to the great depression.

No matter what way you cut it, the biggest stocks in the US are massive relative to the rest of the market. Can these stocks continue to get bigger? At some point they begin running into the law of larger numbers, they would need to become the entire US economy.
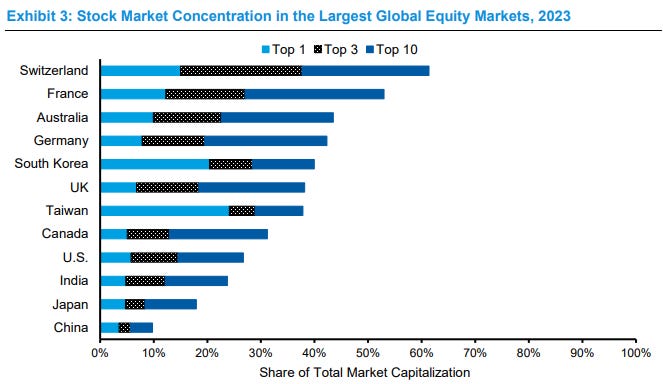
US index investors may worry about concentration but compared to other countries, the S&P 500 is relatively diversified.
Looking back at previous decades, the world’s largest stocks don’t tend to remain the largest stocks over a 10 year period.
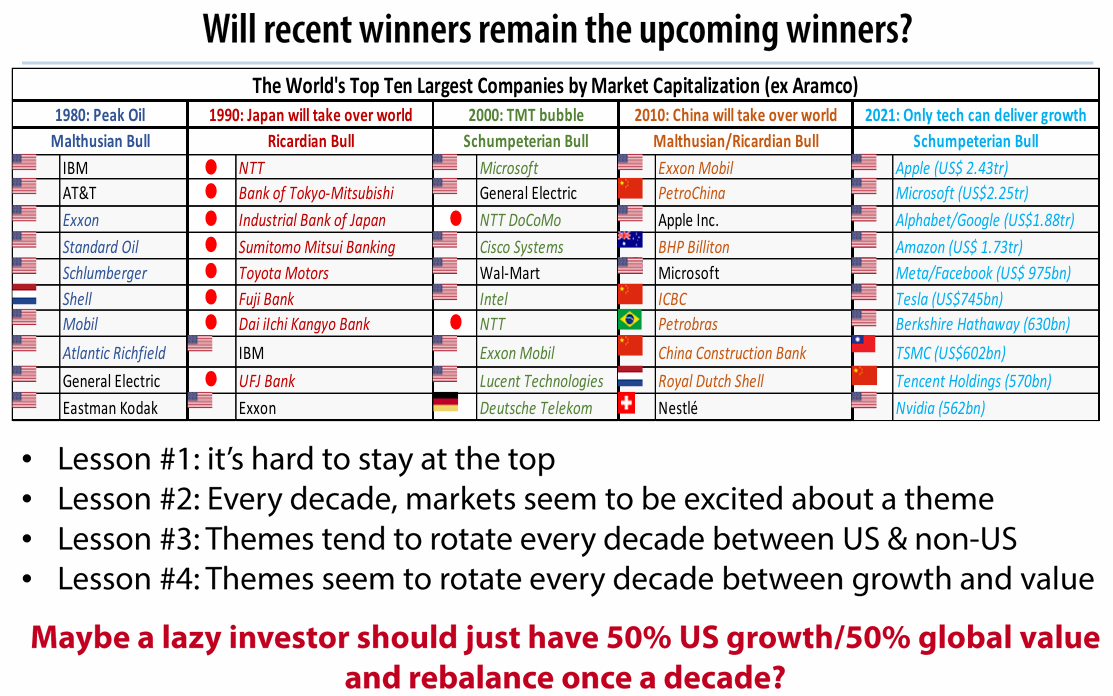
Market leaders shift over time, new innovators emerge disrupting past leaders.
Looking at valuations, Tesla is the standout expensive stock. The others trade above the US market average (21x) to varying degrees.
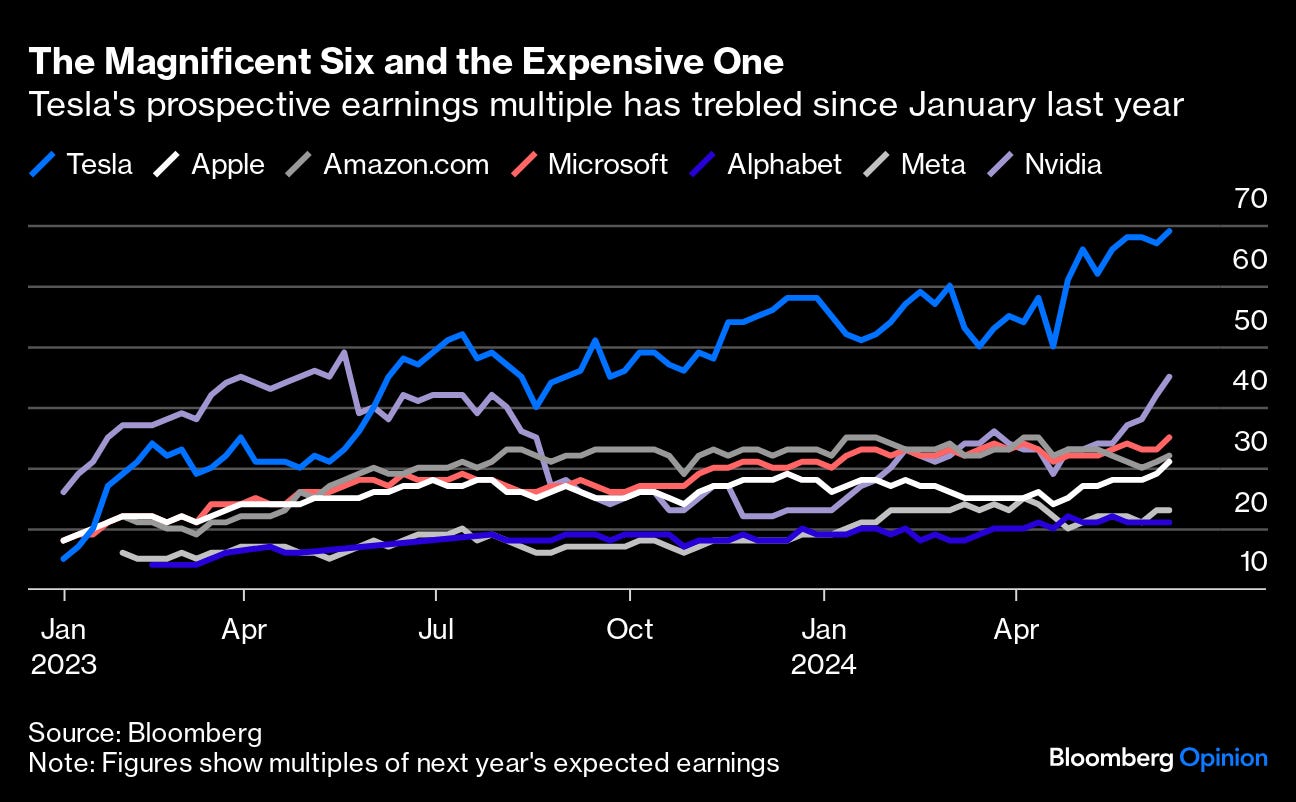
The market is currently assigning a premium to the largest companies.

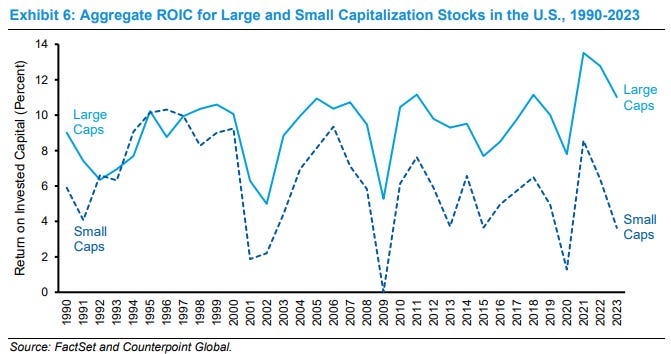
Investors must determine whether these valuations are justified. Part of the crowding is driven by these large companies generating better returns on invested capital.
This rising disparity in ROIC does not directly address the ROIC for the top companies that have driven concentration higher. We estimate that the ROIC in calendar 2023 was 46.6 percent for the top company by market capitalization, averaged 29.6 percent for the top 3, and averaged 27.4 percent for the top 10. The aggregate ROIC for the Russell 3000, an index that captures most U.S. public companies, was 10.1 percent. We exclude companies in the financial and real estate sectors.
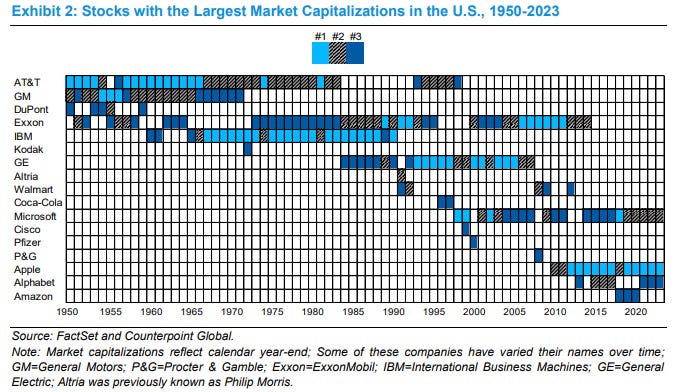
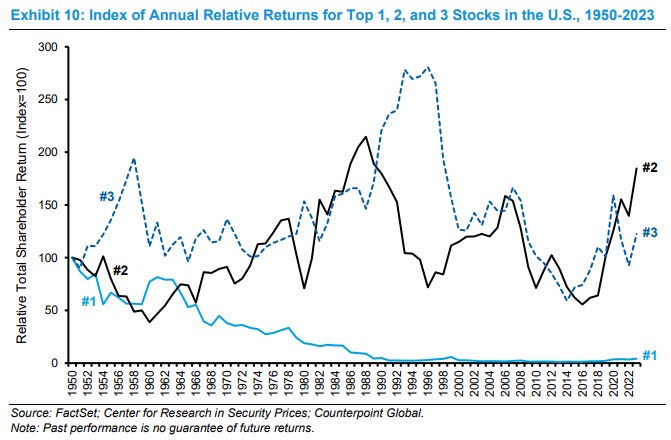
The top stock has historically been a bad investment. Specifically, the arithmetic average of the series of annual returns of the top stock relative to the S&P 500 from 1950 to 2023 was -1.9%. The second and third largest stocks fared considerably better. The index for the second largest stock had an average arithmetic return of 2.6 percent and a geometric return of 0.8%.
But the past 10 years have been different and difficult for active managers. The largest stocks in the US have consistently outperform.
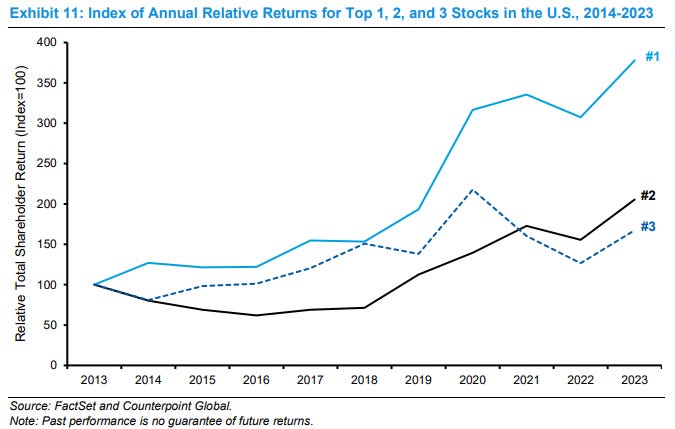
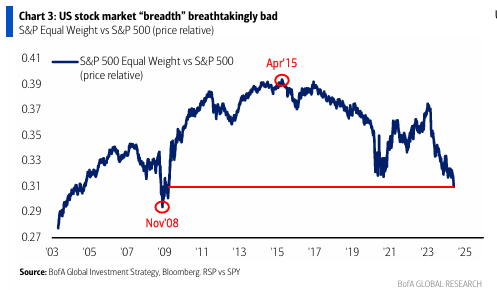
Will the outperformance continue or is it time to get long the equal weighted S&P 500?