
Navigating Lost Decades

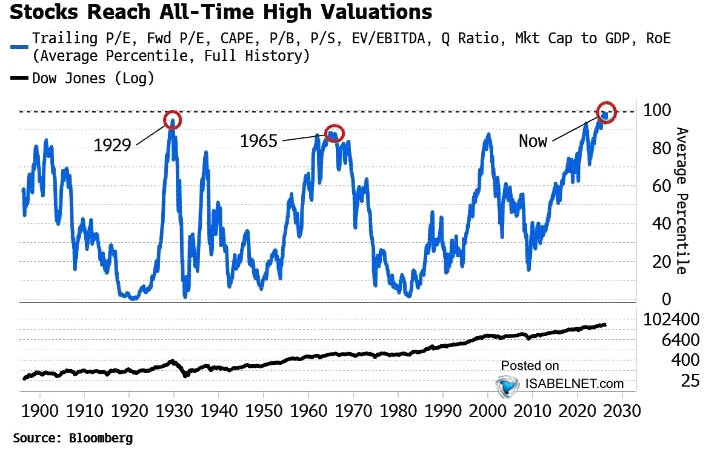
As markets stumbled yesterday, it is a good time to evaluate whether "stocks for the long run" remains an appropriate strategy. While investors have benefited handsomely since 2022, current valuation metrics suggest markets are historically expensive. (ISABELNET)
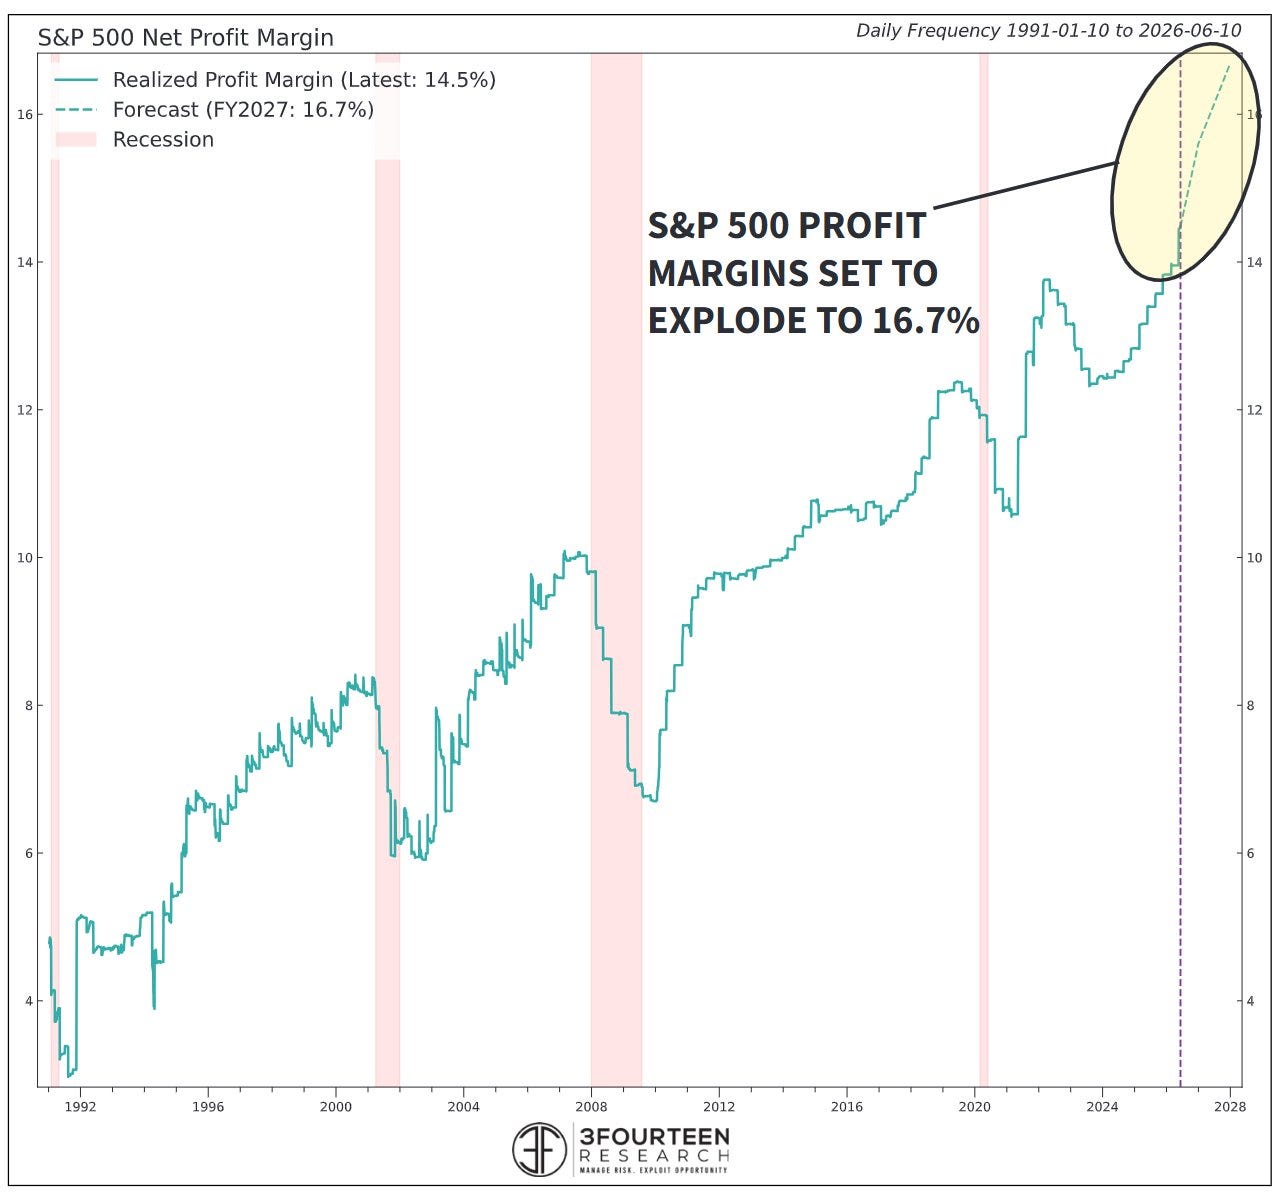
The current regime is uniquely margin and earnings-driven. S&P 500 trailing margins sit at 14.5% and are projected to reach 16.7% by 2027. While margins have mean reverted for 100 years, the bull case argues that technology has permanently displaced labor to sustain these record levels. (@WarrenPies)
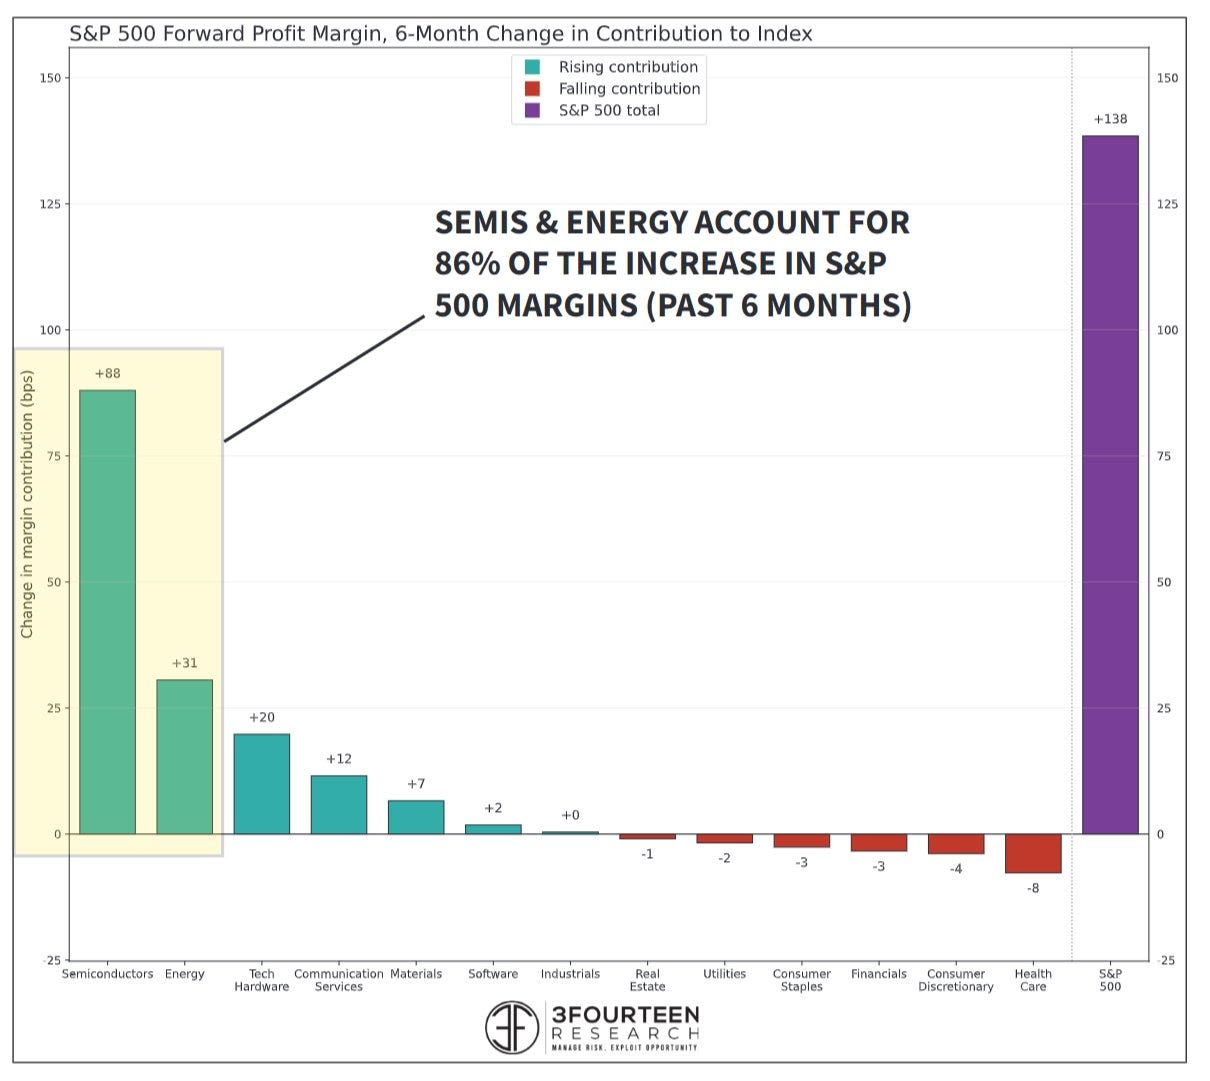
Much of the margin expansion is concentrated in semiconductors, driven by hyperscalers building out data centers at any cost. (@WarrenPies)
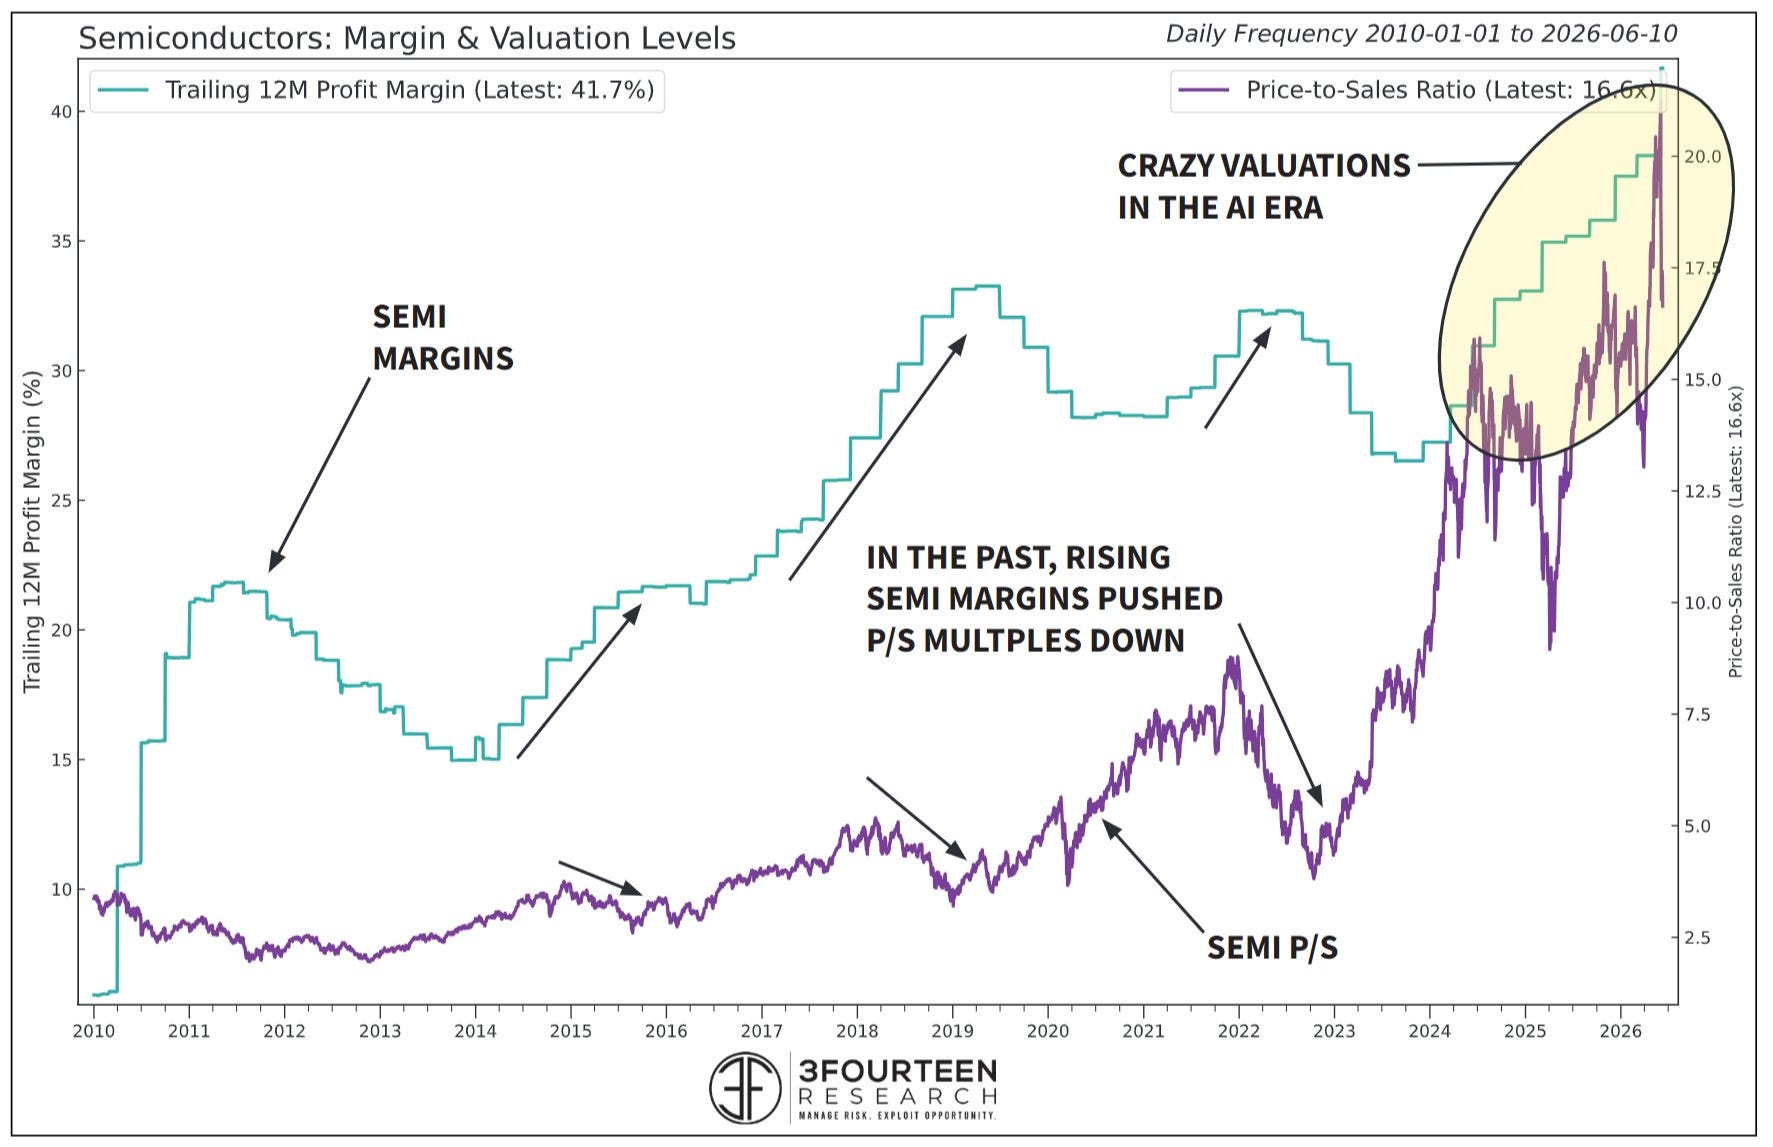
Historically priced as a cyclical industry where multiples fell as margins peaked, semis have recently seen multiples explode alongside all-time high margins, signaling either a structural shift or exuberance. (@WarrenPies)
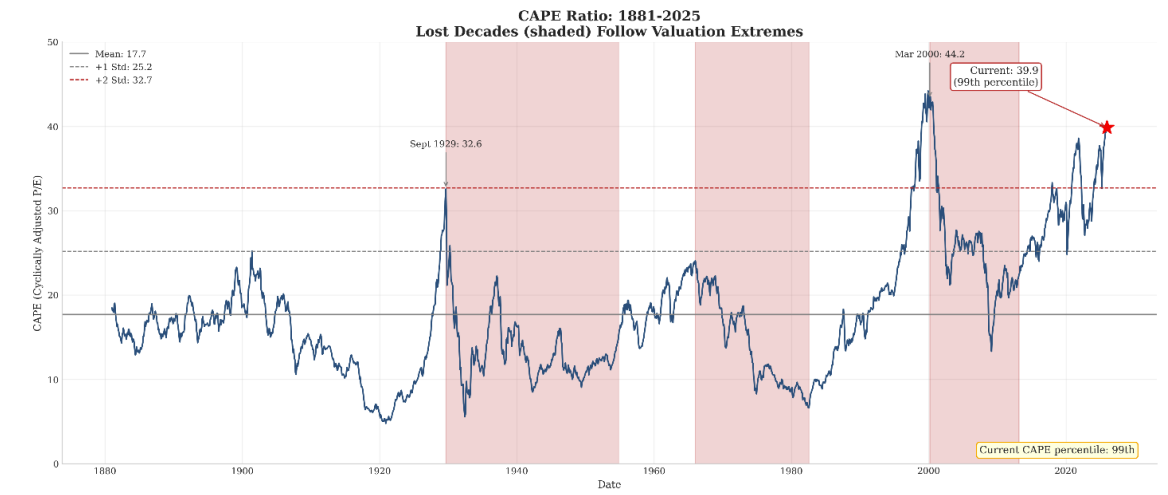
With unsustainable earnings and multiples, comes the prospect of lost decades. While 155 years of U.S. equity data shows an unmistakable upward trend of 7.1% annualized real returns, that same history reveals three distinct "lost decades" where buy-and-hold investors suffered extended drawdowns and impaired compounding. (Tamarisk Capital Management)
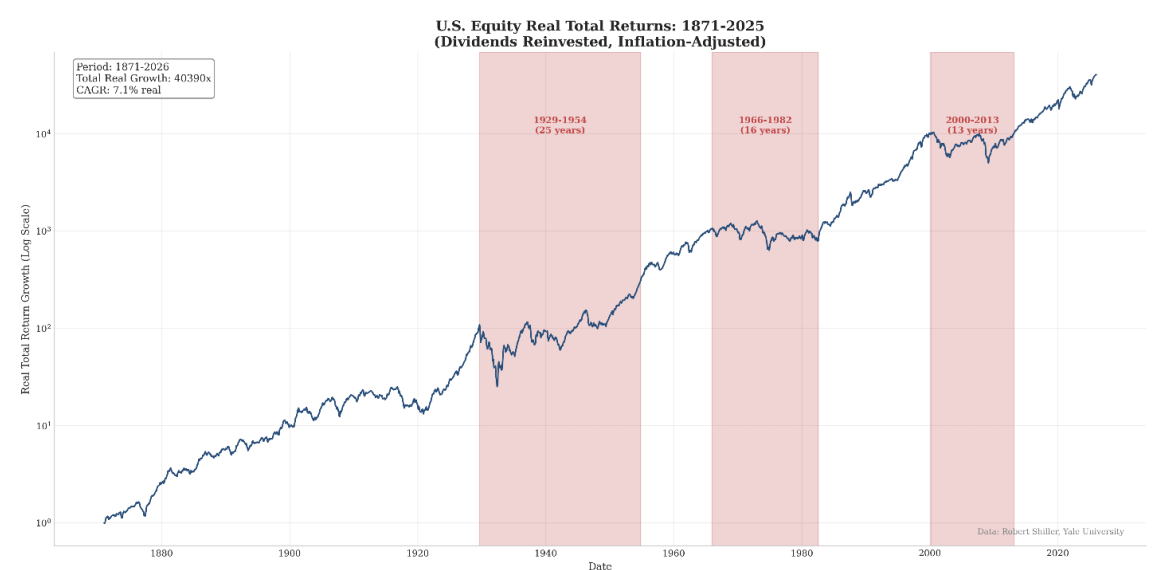
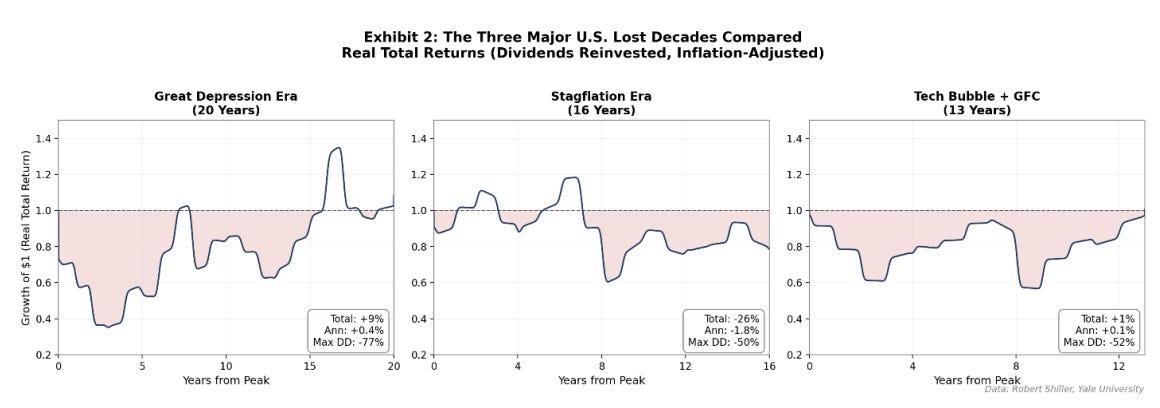
The Great Depression delivered a full quarter-century of zero real returns and left generation-wide behavioral scars. From 1966 to 1982, stagflation and oil shocks drove a -1.77% annualized real return and a 50% drawdown. From 2000 to 2013, the dot-com bust and the Global Financial Crisis resulted in a mere 0.05% annualized real return alongside a 52% drawdown. (Tamarisk Capital Management)
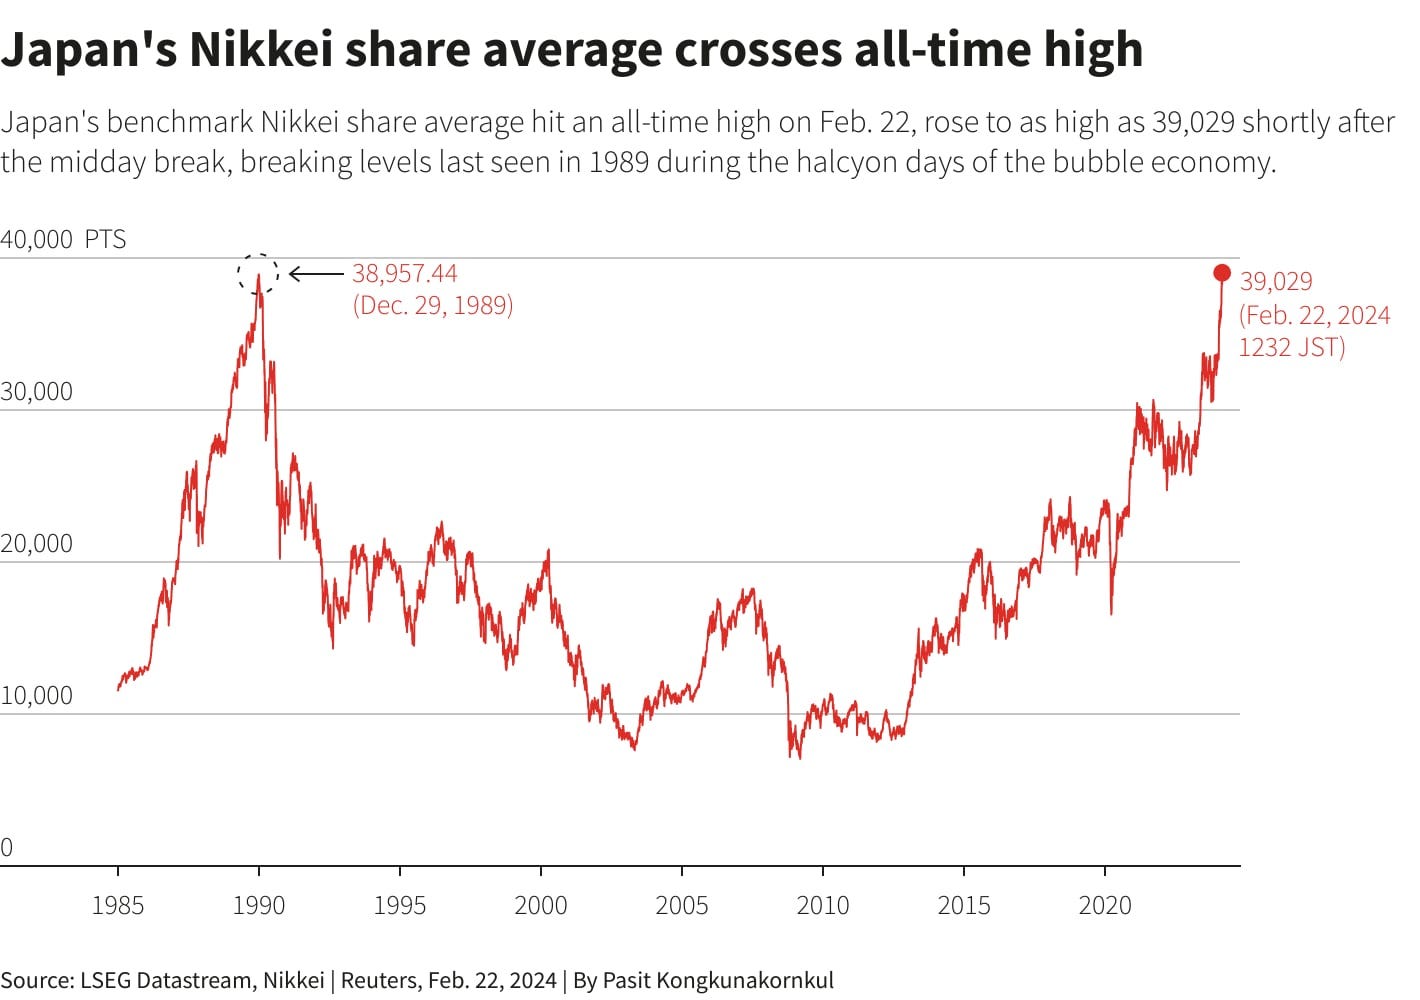
International precedent shows these periods can last even longer. Japan’s Nikkei 225 required 35 years (1989 to 2024) to reclaim its peak, while Europe’s Euro Stoxx 50 and the UK's FTSE 100 took 25 years to recover from their 2000 peaks, proving that eventual recovery within an investor's lifetime is not an immutable law. (Reuters)
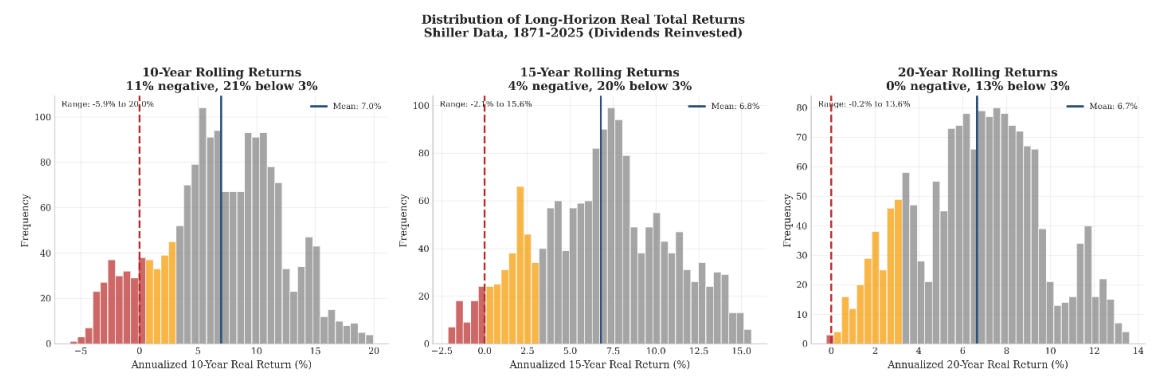
This risk is statistically significant. Historically, 10% of 10-year holding periods delivered negative real returns, and 21% returned under 3% annually. Even over 20-year horizons, 3% of periods yielded negative real returns, and 16% fell below 3% annually. (Tamarisk Capital Management)
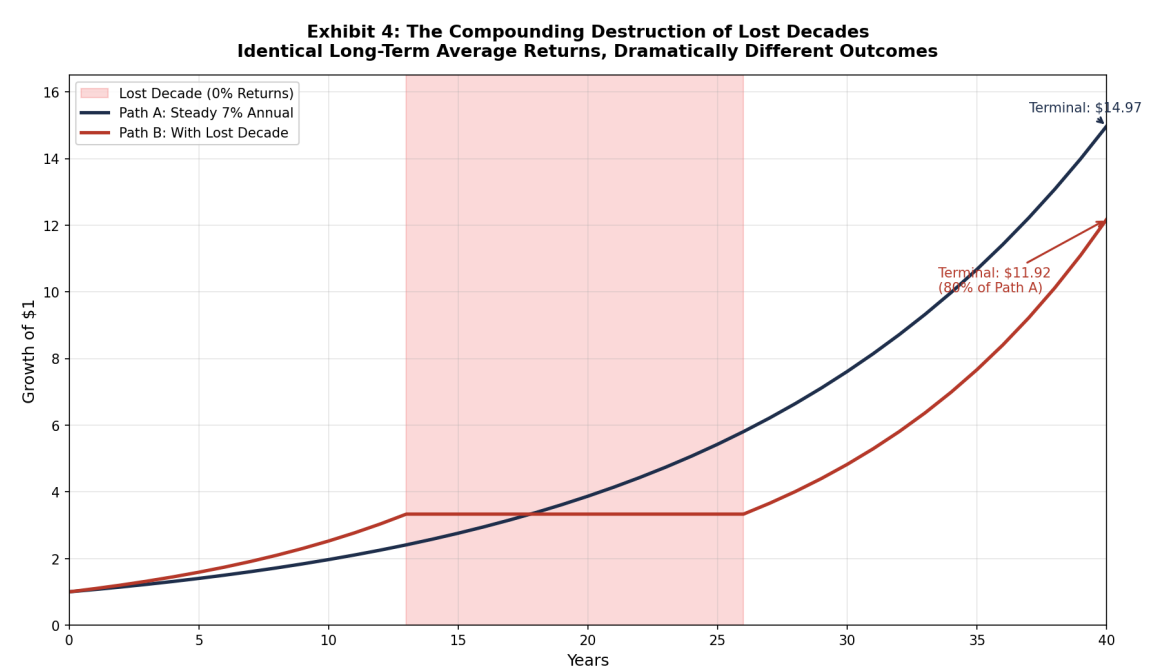
Lost decades inflict permanent damage because missed compounding cannot be recovered, even if subsequent returns normalize to historical averages. For example, consider two 30-year wealth paths targeting the same 7% average annual return. Path A compounds steadily at 7% each year, while Path B inserts a 13-year interval of zero returns in the middle. Despite having the same arithmetic average return, Path B achieves only 80% of Path A's terminal wealth. This creates a permanent gap that does not self-correct, illustrating why flat periods represent lasting wealth destruction rather than a temporary timing effect. (Tamarisk Capital Management)
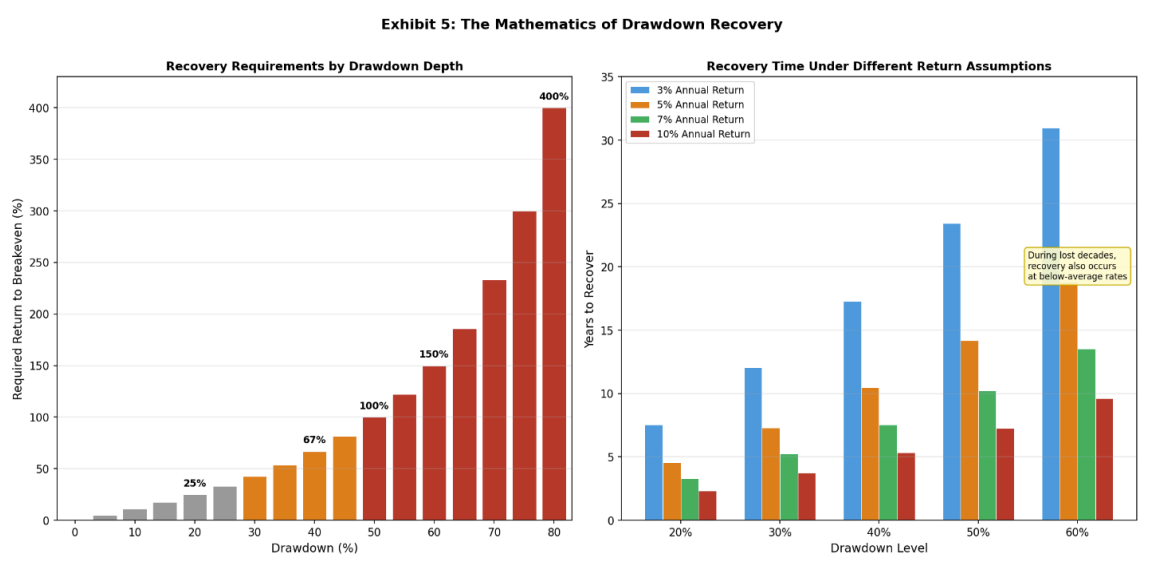
And drawdown recovery is asymmetric: a 50% loss requires a 100% gain to break even, which is why the 52% drawdown from the 2000 peak took until 2013 to achieve real recovery. (Tamarisk Capital Management)
Tying it back to the first valuation chart and specifically isolating CAPE, it has only been higher once, during the dot-com bubble. (Tamarisk Capital Management)
The Cyclically Adjusted Price-to-Earnings (CAPE) ratio highlights this vulnerability. Historically, starting CAPE explains 24% of the variance in subsequent 10-year returns and 33% of 15-year returns. (Tamarisk Capital Management)
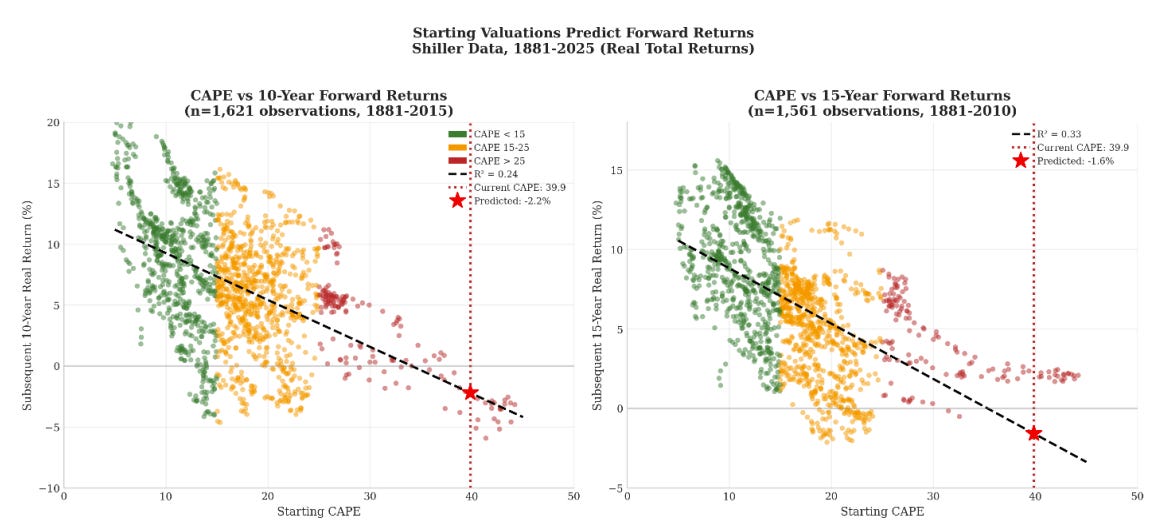
When historical CAPE was in its lowest quintile (averaging 9.0), subsequent 10-year returns averaged 10.7% with no negative outcomes. In the highest quintile (averaging 29.5), returns dropped to 3.6%, with 24% of outcomes turning negative. Today’s CAPE of 39.9 sits well above the highest historical quintile, a level reached only briefly around 1929 and 2000. (Tamarisk Capital Management)
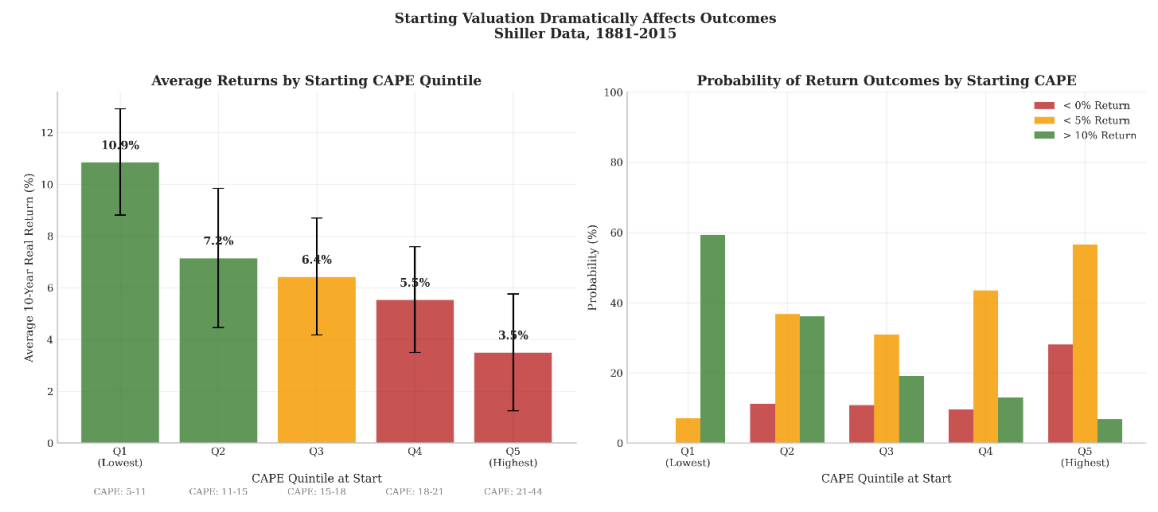
This is not a market top call, as fortunes are made and lost in manias. With valuations exceeded only once in modern history, the choice is not between optimism and pessimism, but between complacency and preparation.
Playing devil’s advocate; if valuations continue to fail as a predictor of returns, it will likely be driven by two structural mechanisms:
Hyperscaler Capex Cycle: Tech giants lever their massive balance sheets to sustain unprecedented capex, continuing to the semis cycle.
Currency Debasement: Persistent fiscal and monetary expansion inflates the nominal value of assets. Even if real growth slows, nominal equity returns can continue to drift upward simply because the purchasing power of the currency is being debased.